Impact of COVID Lockdown on Price Volatility of Pineapple in Vazhakulam, Kerala

Price fluctuations pose a major challenge in horticulture, especially for perishable crops like pineapple. Vazhakulam in Kerala is a leading hub for pineapple cultivation, with strong interstate marketing networks. This study investigates price volatility in the Vazhakulam pineapple market during covid lock down using daily price data from January 2017 to September 2022. The data was segmented into pre-pandemic (Jan 2017–Mar 2020) and pandemic/post-pandemic (Apr 2020–Sep 2022) periods. Time-series modeling using ARCH and GARCH approaches in R revealed that GARCH(1,1) was the most suitable model for capturing volatility patterns. Results showed significantly higher price instability during the pandemic period, driven by transport disruptions and reduced consumer demand. This volatility affected the economic viability of pineapple farming, leading many producers to reduce cultivation. The findings highlight the need for targeted policy support and risk management strategies to stabilize fruit markets and protect farmer livelihoods during times of crisis.
price volatility, ARCH, GARCH, COVID, Vazhakkulam, pineapple
![]()
![]()
![]()
1 Introduction
Price volatility is one of the significant sources of risk in agriculture especially in fruits and vegetable production. It is defined as the directionless fluctuations in prices that cannot be predicted with market fundamentals (Prakash 2011). Reasons for price volatility include supply-side shocks due to severe weather events or diseases, variations in demand, distortions in trade policies and supply chain disruptions (Gilbert and Morgan 2010; Ait Sidhoum and Serra 2016). The increasing unpredictability of changing economic and natural environment (Tothova 2011) and seasonal nature of the fruits and vegetables also amplifies price volatility. Moreover, poor shelf life of horticulture crops increases risk and leads to unstable markets (Cook 2011).
Vazhakulam in Ernakulam district has become the major hub for pineapple cultivation in Kerala (Joy 2013). Owing to its unique feature Vazhakulam pineapple has got Geographical indication tag also. Pineapple produced from the region has a long value chain and is marketed to various states like Karnataka, Tamil Nadu, Maharashtra, Gujarat, Madhya Pradesh, Rajasthan, Andhra Pradesh, Delhi mainly through road ways. Limited quantity of fresh pineapple is being exported to Gulf countries in special packings (Pineapple Growers Association 2018).
Pineapple is a globally traded fruit crop from Kerala that had always been subject to price volatility. It is mainly because of the seasonal variations in demand for pineapple in markets. Climate change induced low production, seasonal disruptions in demand and supply are the main factors that affect price volatility. It was noted that the COVID induced lock down had severely affected the pineapple prices and farmer suicides were reported during the period. This pandemic had a significant negative impact on all sectors of human life, including the economy, food security and health (Saadat, Rawtani, and Hussain 2020). According to (Jribi et al. 2020), the pandemic had the potential to hinder the progress towards meeting several Sustainable Development Goals (United Nations SDG 2015-2030), in particular, SDG 2 (End Hunger) and SDG 12 (Ensure sustainable consumption and production patterns). There were widespread disruptions in agriculture supply chain at the beginning of the lockdown (FAO 2021). It further lead to the scarcity of labour, disrupted supply chains and lack of demand and logistics restrictions in the agricultural sector (Cariappa et al. 2021).
Although the price volatility of different agricultural commodities has been researched extensively in recent periods (Gilbert and Morgan 2010; Sabu, Kuruvila, and Manojkumar 2019; Yu et al. 2020), a lack of knowledge exists in the pineapple sector of Kerala. The knowledge about the price risk and volatility associated with the pineapple sector is important for pineapple farmers during the pandemic. This information is critical for developing suitable price risk management strategies, for coping up with similar situations. Hence the present study aims to analyse the price behaviour of Pineapple in Kerala.
2 Materials and methods
2.1 Study area
The study was conducted in Ernakulam district of Kerala. The study area was selected purposively as it has the largest area under pineapple cultivation in Kerala. Out of the total area under pineapple in Kerala, 58.73 per cent lies in Ernakulam district which produces about 63 per cent of the production of the state in the year (Government of Kerala 2020a). From the district, Muvattupuzha Block Panchayath was purposively selected based on the maximum area under pineapple cultivation. Three pineapple-growing grama panchayats viz., Avoly, Manjalloor, and Kalloorkkad were selected from the block panchayat randomly. Forty farmers each were randomly selected from these grama panchayaths making a total sample size of 120 farmers.
2.2 Sampling and data collection
The study used time series data of daily prices of pineapple from January 2017 to September 2022 collected from Vazhakulam Pineapple Growers Association(PGA). Price collected can be aptly considered as representative price as most of the pineapple farmers are organized under PGA and trade pineapple through them. The prices represent the farm gate price received by the farmers and it is easily available in the website of Pineapple Growers Association(Pineapple Growers Association 2018). Data on daily prices of pineapple from January 2017 to March 2020 was taken as pre-COVID period and from April 2020 to September 2022 is taken as COVID-post-COVID period. January 2017 to September 2022 was taken as the overall period.
2.3 GARCH models
The uncertainty surrounding prospective price fluctuation is referred to as volatility. There are different methods to estimate volatility such as historical moving average, Exponential Weighted Moving Average (EWMA), Auto Regressive Conditional Heteroscedasticity (ARCH) introduced by Engle (1982) and Generalized Auto-Regressive Conditional Heteroscedasticity (GARCH) introduced by Bollerslev (1986).
Sekhar (2004) compared the price volatility of different agricultural commodities in major Indian and international markets by using GARCH model. This model provided evidence on whether the estimated volatility is statistically significant or not. It also measures the persistence of volatility (Sabu 2015).
The ARCH process introduced by Engle (1982) explicitly recognizes the difference between the unconditional and the conditional variance allowing the latter to change over time as a function of past errors. The GARCH model of Bollerslev (1986) is an important type of time series model for heteroscedastic data. It explicitly models a time-varying conditional variance as a linear function of past squared residuals and of its past values. GARCH models are an extension of the ARCH models first introduced by Engle (1982) as it basically introduces a lagged conditional variance to the information set of an ARCH model. An ARCH model applied to price volatility basically assumes that a dependent variable of commodity prices, \(P_i\), is generated by the autoregressive process:
\[p_i = \phi_0 + \sum_{i=1}^{k} \phi_{1} P_{t-1} + \varepsilon_t \tag{1}\]
To generate the ARCH\((p)\) process, we express the conditional variance of the above expression as a function of its past values squared:
\[\varepsilon_t \mid \Omega_{t-1} \sim N(0, h) \tag{2}\]
\[h_t^2 = \delta + \sum_{i=1}^{p} \alpha_i \varepsilon_{t-i}^2 \tag{3}\]
Where, \(h_t^2\) denotes the conditional variance of the information set \(\Omega_{t-1}\) that is available at time \(t-1\), and \(\delta > 0\), \(\alpha_i \geq 0\) for all \(i = 2 \ldots p\) and \(\alpha_1 + \alpha_2 + \cdots + \alpha_m < 1\), which are necessary to make \(\varepsilon_t^2\) positive and covariance stationary.
The generalization of the ARCH process given in Equation 3 is as follows (Bollerslev 1986):
\[ h_t^2 = \delta + \sum_{i=1}^{p} \alpha_i \varepsilon_{t-i}^2 + \sum_{i=1}^{q} \beta_i h_{t-i}^2 \tag{4}\]
The GARCH model in Equation 4 depicts the conditional variance of a price series to depend on a constant, past news about volatility (i.e. the \(\varepsilon_{t-1}^2\) terms). Including the lagged conditional variances might capture the “adaptive learning” phenomenon. The benefit of the GARCH specification is that it contains fewer coefficient restrictions. For a well-defined variance and covariance function: \(\delta, \alpha > 0; \beta \geq 0\), and \(\alpha + \beta < 1\).
Persistence of volatility in the commodity series is measured by the sum of \(\alpha + \beta\). Downward price changes are often followed by higher volatility than upward movements of the same magnitude (Herrera and Espinel 2008).
Models aim to define volatility clustering and effects such as kurtosis, forming the basis of dynamic volatility models.
The key is that volatility, rather than remaining constant or moving in a monotonic manner over time, is dependent on past realisations of the associated volatility i.e. the error variance is related to the squared error terms over several periods in the past (Singh 2020).
The ARCH-GARCH model was used to analyse the volatility and it was estimated using R software (R Core Team 2023). From the different models, Standard GARCH (1,1) (SGARCH) model was identified as the best model for this study based on the smallest Akaike Information Criteria (AIC) and Bayesian Information Criteria (BIC) values (Lestari et al. 2022). This model distinguishes the predictable and unpredictable components of prices and also allows the variance of the unpredictable element to be time-varying. Such time varying conditional variances were estimated by using the SGARCH (1,1) model (Gujarati, Porter, and Gunasekhar 2009) and it was used to identify periods of high volatility.
The GARCH(1,1) model is specified as:
\[Y_{it} = \alpha_0 + \beta_1 P_{t-1} + \beta_2 P_{t-2} + \varepsilon_t \quad ; \quad t = 1, 2, \ldots, t \tag{5}\]
\[\sigma^2_{i,t} = \theta + \alpha_i \varepsilon^2_{i,t-1} + \beta_i \sigma^2_{i,t-1} \tag{6}\]
Where \(P_{t-1}\) is the price at time \(t-1\) and \(\sigma^2_{i,t}\) is the conditional error variance at time \(t\). The term \((\alpha_i + \beta_i)\) indicates the degree of persistence in price volatility. If the sum \((\alpha_i + \beta_i)\) is close to 1, it implies a high level of volatility persistence (Devi, Srikala, and Ananda 2015).
The general form of a GARCH(\(p\), \(q\)) model is:
\[\sigma^2_{i,t} = \omega + \sum_{i=1}^{p} \beta_i \sigma^2_{t-i} + \sum_{i=1}^{q} \alpha_i \varepsilon^2_{t-i} \tag{7}\]
Equation Equation 5) captures the autoregressive part of the price model, while Equations Equation 6 and Equation 7 describe the time-varying variance component.
3 Results
3.1 Average monthly prices behaviour
In Vazhakulam, fresh pineapple is harvested at two stages: as green pineapple (harvested at 115 days after the ethephon application) and as ripe pineapple (harvested at 120–125 days after the ethephon application).
The present study analyzed the price volatility of both ripe and green pineapple using time series data of daily prices from January 2017 to September 2022. For analytical purposes, the data set was divided into the following three periods:
- Pre-COVID period: January 2017 to March 2020
- COVID–Post-COVID period: April 2020 to September 2022
The average monthly prices of both green and ripe pineapple during the pre-COVID and COVID–post-COVID periods are presented in Figure 1 (a) and Figure 1 (b), respectively.
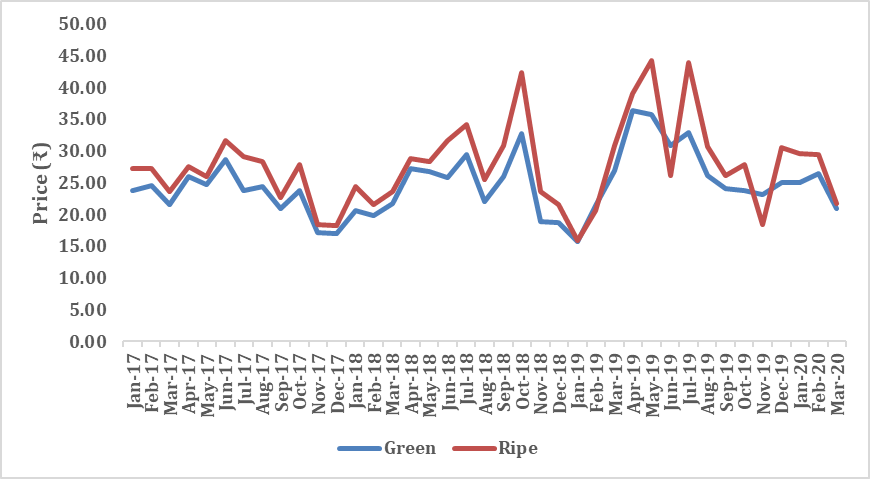
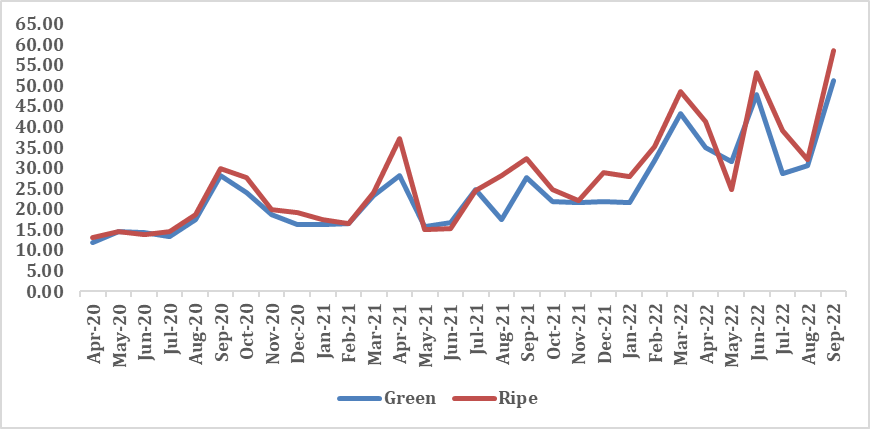
Price of pineapple usually stood high during the summer months of April and May coinciding with summer and one-month long Ramdan fasting. So, many farmers targeted the harvest of the crop during these months. But in April 2020, during the first lockdown period due to strict restrictions, many pineapple plantations were abandoned without harvesting. This was mainly due to the unavailability of migrant labours (as they went back to their hometown fearing the disease). So, a steep decline in price was observed during that period. Prices started increasing as the restrictions were lifted gradually. Again in 2021, there was price drop in the months of May and June due to another lockdown and restrictions.
The price drop was to the level of Rs. 10/kg, which put farmers in distress. During the survey, many farmers reported that the price of pineapple had even dipped to Rs. 5/kg during the COVID period as they were not able to transport the produce to the Vazhakulam pineapple market. So, they sold produce in nearby markets. Many of the plantations were kept unharvested and harvested fruits fetched only very low price. Restrictions in interstate and intra state transport, fear of spread of virus through the fruits etc. worsened the situation. Many farmers terminated their lease contracts with landowners before expiry due to financial crisis and were unable to pay the lease amount and continue farming operations. Farmers reported that the reduction in the cultivated area had impacted total pineapple production from Vazhakulam. As the restrictions were gradually lifted towards the end of 2021, situation became normal and price hike was observed due to a reduced supply of pineapple to the market, with the demand for pineapple was same as earlier.
3.2 Estimation of volatility using GARCH
GARCH models are very popular in the analysis of price volatility. Standard GARCH(1,1) model was fitted to study the volatility in the prices of pineapple. The estimates of GARCH(1,1) model for ripe pineapple and green pineapple are presented in Table 1 and Table 2.
| Parameter | Pre-COVID | COVID-post COVID | Overall |
|---|---|---|---|
| \(\mu\) | 24.078\({^{**}}\) | 13.458\({^{**}}\) | 23.476\({^{**}}\) |
| \(\omega\) | 1.309\({^{**}}\) | 0.141\({^{**}}\) | 0.576\({^{**}}\) |
| \(\alpha_1\) | 0.412\({^{**}}\) | 0.221\({^{**}}\) | 0.347\({^{**}}\) |
| \(\beta_1\) | 0.164\({^{*}}\) | 0.639\({^{**}}\) | 0.409\({^{**}}\) |
| \(\alpha + \beta\) | 0.576 | 0.860 | 0.756 |
| Parameter | Pre-COVID | COVID-post COVID | Overall |
|---|---|---|---|
| \(\mu\) | 19.399\({^{**}}\) | 14.133\({^{**}}\) | 19.776\({^{**}}\) |
| \(\omega\) | 1.044\({^{**}}\) | 0.069\({^{**}}\) | 0.254\({^{**}}\) |
| \(\alpha_1\) | 0.489\({^{**}}\) | 0.118\({^{**}}\) | 0.261\({^{**}}\) |
| \(\beta_1\) | 0.124\({^{*}}\) | 0.798\({^{**}}\) | 0.584\({^{**}}\) |
| \(\alpha + \beta\) | 0.613 | 0.916 | 0.845 |
The results showed that the GARCH(1,1) model estimates for ripe and green pineapple prices were significant for the pre-COVID, COVID and post-COVID, and overall periods. It indicated that the volatility in the prices of pineapple was persistent despite the COVID-induced lockdown.
It is evident from Table 1 that the sum of coefficients \(\alpha\) and \(\beta\) for the prices of ripe pineapple was higher in the COVID-post-COVID period, followed by the overall period. This indicated higher volatility in the prices of ripe pineapple during the COVID-post-COVID period. A similar trend was observed in the price of green pineapple (Table 2). This might be related to the reduced demand for pineapple in the market as a result of changes in the consumption behaviour of people during the pandemic. A study conducted by Yu et al. (2020) on the impact of COVID-19 on the prices of major food products in China found that rice and wheat showed no significant changes in prices after the COVID lockdown, whereas prices of cabbage showed higher volatility.
Among the green and ripe pineapple prices, higher volatility was observed in the prices of green pineapple as compared to ripe pineapple for all the periods—pre-COVID, COVID-post-COVID, and overall. The value of the \(\alpha + \beta\) term for green pineapple prices was close to one (0.916) during the post-COVID period, which indicated higher volatility in the prices of green pineapple after the lockdown. This could be because the effect of transportation restrictions during the lockdown on green pineapple was greater as it was marketed to North India, whereas mature ripe pineapple was marketed in Kerala and nearby states. In a similar attempt, while studying the effect of the COVID-19 pandemic on the prices of rice, chilli, and garlic in Indonesia, it was found that due to the government’s different social assistance programs, the impact of COVID-19 on the prices of rice was negligible, whereas the prices of chilli and garlic had decreased due to the pandemic. The study also found that the effect of COVID-19 on the prices of horticultural products was higher as compared to that on the prices of food grains (Zahraturrahmi et al. 2021).
3.3 Volatility clustering
To provide more detailed insights in to the volatility in price of pineapple, the volatility clustering in daily prices of both green and ripe pineapple for pre-COVID, COVID-post-COVID and overall periods are shown in Figure 2 given below. These figures clearly underpin the estimated results of GARCH model.
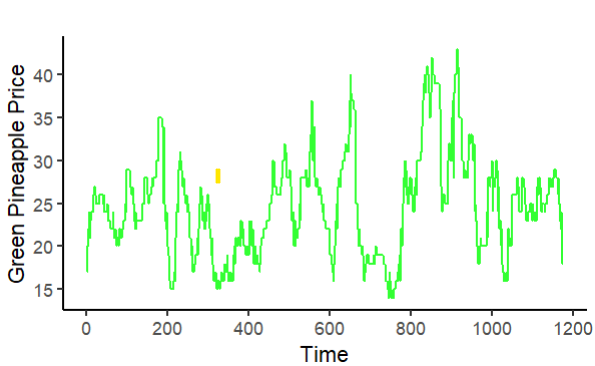
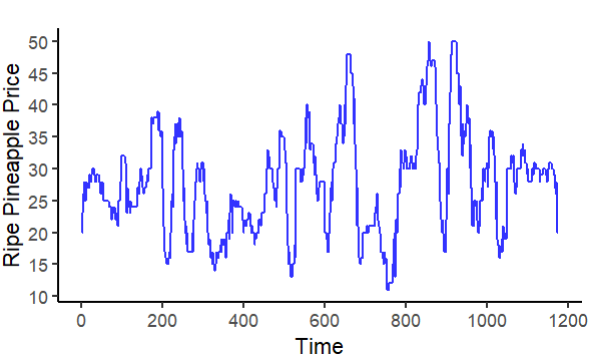
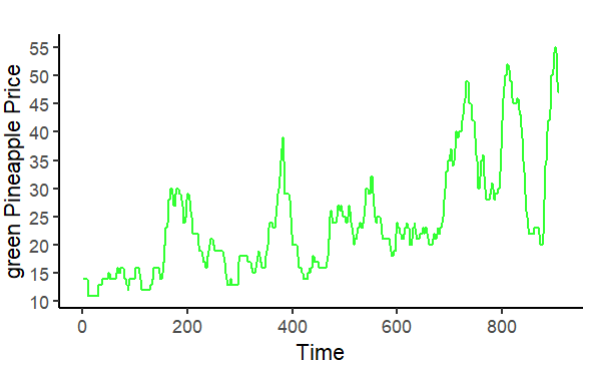
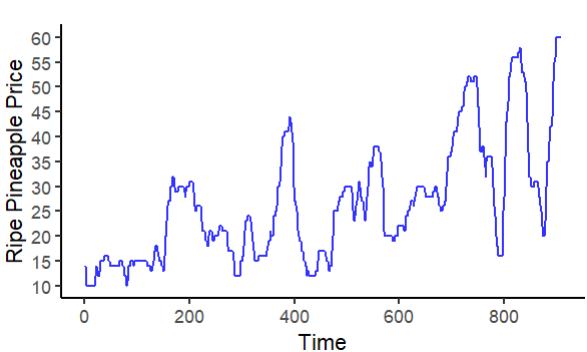
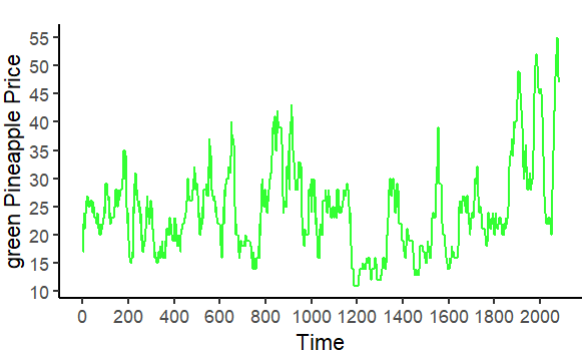
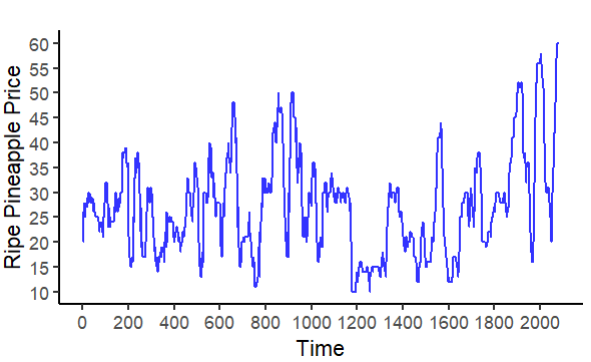
The Figure 2 indicated that there was volatility in the prices of pineapple. But the volatility was more prominent during the COVID-post-COVID period. A lowest price of Rs.10 per kg was realized during the COVID period and it recovered gradually to Rs.60 per kg during the post-COVID period. According to Pineapple Growers Association Kerala, the farm gate price had come down to Rs.10 per kg compared to Rs.40 in the previous year due to lockdown (Kumar 2020). Thus, the pineapple farmers were in distress and they were unable to pay off their debts. There was also a report of farmer suicide due to financial losses in pineapple cultivation (Government of Kerala 2020b).
In a similar attempt, (Kaur 2021) in her study observed persistence of volatility in the prices of cereals, pulses and fruits before and after COVID-19. (Arumugam, Kanagavalli, and Manida 2020) revealed that the problem of labour shortage caused by a fear of viral transmission led to the wastage of harvested commodities, primarily fruits and vegetables, and also demand reduction of produce in the market. In a study conducted by (Pandya et al. 2021), the prices of all agricultural items dropped by about 70 percent due to a rapid drop in demand and an excess supply of farm products. According to (Hossain et al. 2020), COVID-19 not only affected physical health but also affected the mental health of farmers.
Discussion
The present study highlights the significant volatility in pineapple prices across pre-COVID, COVID-post-COVID, and overall periods in the Vazhakulam market. Results from the GARCH(1,1) model indicated that both green and ripe pineapple prices experienced persistent volatility, with a pronounced increase during the COVID-post-COVID period. This was evident from the higher \(\alpha + \beta\) values observed, especially for green pineapple, suggesting a strong memory in the price volatility process during this period.
Several factors contributed to this heightened volatility. The COVID lockdowns imposed transport and logistics constraints and disrupted supply chains which caused a temporary collapse in market demand. This was reflected in steep price drops, with the price of pineapple falling as low as Rs 10 per kg during the lockdown, as reported by the Pineapple Growers Association (Kumar 2020). The inability to harvest or transport produce due to labour shortages further aggravated the situation (Arumugam, Kanagavalli, and Manida 2020).
The findings are consistent with similar studies on other horticultural commodities. (Kaur 2021) found continued volatility in food prices post-COVID, and (Pandya et al. 2021) noted an average price drop of 70% in farm produce during the early pandemic phase. Moreover, the psychological and financial stress induced by the pandemic led to cases of farmer distress and suicide, further underlining the socioeconomic impact (Hossain et al. 2020).
It was also evident that green pineapple prices were more volatile than ripe ones, potentially due to their greater dependence on inter-state transport, especially to North Indian markets. These insights underscore the vulnerability of perishable commodity sectors to external shocks and reinforce the need for effective price risk management, timely market intelligence, and supportive agricultural policy interventions.
Conclusion
Pineapple cultivation remains a remunerative agricultural activity for many farmers in Kerala, particularly because it is one of the major fruit crops transported from the state to other parts of India. This study examined the price volatility in the Vazhakulam pineapple market during the pre-COVID, COVID-post-COVID, and overall periods. Findings revealed that pineapple farmers in Kerala have historically faced frequent price fluctuations, with significantly heightened volatility observed during the COVID-post-COVID period. This increase was primarily attributed to transportation restrictions and a fall in market demand due to the pandemic.
These results have important implications for policymakers. To stabilize the pineapple market, there is a need to develop more robust price risk management mechanisms. Although the Government of Kerala has fixed a base price of Rs 15 per kg for pineapple (Government of Kerala 2020b), the study found the average cost of production to be Rs 17.33 per kg. Therefore, it is recommended that the base price be revised to at least Rs 20–22 per kg to ensure profitability. The findings highlight the need for targeted policy support and risk management strategies to stabilize pineapple marketsin Kerala and protect farmer livelihoods during times of crisis.
References
All prices mentioned in this study are in Indian Rupees (Rs), the official currency of India. For clarity, “Rs” is used as a symbol for INR (Indian National Rupee) throughout the text. At the time of the study, the exchange rate was approximately 1 USD = 85.41 INR, although this may vary over time.
Publication Information
- Submitted: 11 June 2025
- Accepted: 16 June 2025
- Published (Online): 18 June 2025
Reviewer Information
Reviewer 1:
Anonymous
Reviewer 2:
Dr. Subash Surendran Padmaja
Scientist
ICAR-National Institute of Agricultural Economics and Policy Research
ORCID: https://orcid.org/0000-0001-6418-4142