Genetic Variability and Diversity Analysis in Sesame (Sesamum indicum L.)
Sesame (Sesamum indicum L.) is an ancient oilseed crop of significant nutritional and economic value, but its productivity remains suboptimal due to limited genetic improvement. This study assessed genetic variability, correlation patterns, and genetic divergence among 40 sesame genotypes to identify superior parents for breeding programs. Evaluating nine quantitative traits, including days to flowering, plant height, branches per plant, and oil content, in a randomized block design with three replications, revealed significant genetic variation. High heritability and genetic advance were recorded for traits such as days to flowering (95.98%) and seed yield per plant (98.69%). Number of capsules per plant showed the highest direct effect on seed yield. Mahalanobis D² analysis grouped the genotypes into six clusters, with plant height contributing the most to total divergence. The study identified genotypes from divergent clusters (III, IV, V, and VI) as potential parents for hybridization to develop high-yielding varieties with improved oil content.
Sesame, genetic variability, heritability, correlation, path analysis, genetic divergence, breeding
![]()
![]()
![]()
1 Introduction
Sesame (Sesamum indicum L., 2n=2x=26) represents one of humanity’s most ancient cultivated oilseed crops, with archaeological evidence suggesting its cultivation dates back over 4,000 years (Bedigian 2015). Known by various vernacular names including Gingelly, Ellu in Malayalam, and Tila in Sanskrit, this crop holds profound cultural and religious significance, particularly in Indian traditions where sesame seeds feature prominently in Hindu religious ceremonies (Wei et al. 2015). The ancient Sanskrit etymology supports the hypothesis that sesame may have been the source of the first extracted vegetable oil, underlining its historical importance in human nutrition (Pathak et al. 2014). Modern nutritional analysis reveals that sesame seeds contain 50–60% oil of exceptional quality, comparable to olive oil in its nutritional profile (Uzun, Yol, and Furat 2008; Anilakumar et al. 2010).
Sesame oil demonstrates remarkable stability compared to other edible oils, primarily attributed to its rich content of natural antioxidants including sesamin, sesaminol, sesamol, sesamolinol, and squalene (Namiki 2007; Kamal-Eldin, Moazzami, and Washi 2011). The oil’s high concentration of polyunsaturated fatty acids, combined with its cholesterol-lowering and blood pressure-reducing properties, has renewed scientific and commercial interest in this ancient crop (Sankar et al. 2006; Gouveia et al. 2014; Dalibalta, Majdalawieh, and Manjikian 2020).
Recent genomic studies have revealed the complex genetic architecture underlying sesame’s agronomic traits, with high-throughput sequencing technologies enabling the identification of quantitative trait loci (QTLs) associated with yield components and stress tolerance (Zhang et al. 2013; Wang et al. 2016; Yu et al. 2019). These advances have opened new avenues for marker-assisted selection and genomic breeding approaches (Wei et al. 2016; Dossa et al. 2017).
Despite its nutritional superiority and agricultural advantages—including drought tolerance, low input requirements, and suitability for crop rotations due to its extensive taproot system (Ashri 2007)—sesame productivity remains disappointingly low. India, while leading globally in both cultivation area (1.8 million hectares) and production (0.87 million tonnes), achieves an average productivity of only 483 kg/ha, significantly below China (1,200 kg/ha) and Turkey (1,100 kg/ha) (FAO 2020; Yahaya et al. 2021).
2 Materials and methods
The experimental material comprised 40 sesame genotypes obtained from four major sources: Kerala Agricultural University (7 varieties), Tamil Nadu Agricultural University (7 varieties), All India Coordinated Research Project on Oilseeds cultures (20 accessions), and National Bureau of Plant Genetic Resources Regional Centre, Vellanikkara (6 accessions).
| Sl. No. | Genotype | Source | Sl. No. | Genotype | Source |
|---|---|---|---|---|---|
| 1 | KYM-1 | ORARS, Kayamkulam | 21 | AVTS-06-9 | ORARS, Kayamkulam |
| 2 | Soma | ORARS, Kayamkulam | 22 | AVTS-06-10 | ORARS, Kayamkulam |
| 3 | Surya | ORARS, Kayamkulam | 23 | IVTS-06-2 | ORARS, Kayamkulam |
| 4 | Tilak | ORARS, Kayamkulam | 24 | IVTS-06-3 | ORARS, Kayamkulam |
| 5 | Tilatara | ORARS, Kayamkulam | 25 | IVTS-06-6 | ORARS, Kayamkulam |
| 6 | Tilarani | ORARS, Kayamkulam | 26 | IVTS.06.8 | ORARS, Kayamkulam |
| 7 | CO-1 | TNAU, Coimbatore | 27 | IVTS.06.12 | ORARS, Kayamkulam |
| 8 | SVPR-1 | CRS, Srivilliputhur | 28 | IVTS.06.13 | ORARS, Kayamkulam |
| 9 | VRI-1 | RRS, Vridhachalam | 29 | IVTS.06.15 | ORARS, Kayamkulam |
| 10 | VRI-2 | RRS, Vridhachalam | 30 | IVTS.06.16 | ORARS, Kayamkulam |
| 11 | TMV-3 | RRS, Vridhachalam | 31 | IVTS.06.22 | ORARS, Kayamkulam |
| 12 | TMV-4 | RRS, Vridhachalam | 32 | IVTS.06.26 | ORARS, Kayamkulam |
| 13 | TMV-5 | RRS, Vridhachalam | 33 | IVTS.06.27 | ORARS, Kayamkulam |
| 14 | TMV-6 | RRS, Vridhachalam | 34 | IVTS.06.28 | ORARS, Kayamkulam |
| 15 | AVTS.06.1 | ORARS, Kayamkulam | 35 | TCR-2511 | NBPGR Regional Station, Vellanikkara |
| 16 | AVTS.06.3 | ORARS, Kayamkulam | 36 | TCR-2527-C | NBPGR Regional Station, Vellanikkara |
| 17 | AVTS.06.4 | ORARS, Kayamkulam | 37 | TCR-3279-A | NBPGR Regional Station, Vellanikkara |
| 18 | AVTS.06.5 | ORARS, Kayamkulam | 38 | TCR-3105 | NBPGR Regional Station, Vellanikkara |
| 19 | AVTS.06.6 | ORARS, Kayamkulam | 39 | TCR-4865 | NBPGR Regional Station, Vellanikkara |
| 20 | AVTS.06.7 | ORARS, Kayamkulam | 40 | YLM-17 | Krishi Bhavan, Alathur |
The experiment was conducted during October 2007 to February 2008 at the Department of Plant Breeding and Genetics, College of Horticulture, Vellanikkara. Seeds were sown in a randomized complete block design with three replications. Plot dimensions maintained a spacing of 45 cm between rows and 20 cm between plants, following standard agronomic practices for the region.Observations were recorded on ten randomly tagged plants per genotype for nine quantitative characters: days to flowering, plant height (cm), number of branches per plant, number of capsules per plant, capsule length (cm), number of locules per capsule, 1000-seed weight (g), seed yield per plant (g), and oil content (%).
3 Results
Analysis of variance in Table 2 revealed highly significant differences (P < 0.01) among genotypes for days to flowering, plant height, and number of capsules per plant, indicating substantial genetic variation suitable for breeding programs.
| Source | df | \(X_1\) | \(X_2\) | \(X_3\) | \(X_4\) | \(X_5\) | \(X_6\) |
|---|---|---|---|---|---|---|---|
| Replication | 2 | 1.66 | 0.09 | 0.19 | 20.96* | 0.29 | 0.20 |
| Treatment | 39 | 32.34** | 1153.46** | 12.47 | 255.09** | 4.31 | 3.30 |
| Error | 78 | 0.45 | 0.96 | 0.12 | 1.43 | 0.019 | 0.17 |
In Table 2, the traits represented by \(X_1\) to \(X_6\) are as follows:
\(X_1\) – Days to flowering
\(X_2\) – Plant height (cm)
\(X_3\) – Number of branches per plant
\(X_4\) – Number of capsules per plant
\(X_5\) – Seed yield per plant (g)
\(X_6\) – Oil content (%)
| Character | Range | Mean ± SE | GCV (%) | PCV (%) | \(h^2\) (%) | GA (%) | ECV (%) |
|---|---|---|---|---|---|---|---|
| \(X_1\) | 18.73 – 34.80 | 27.35 ± 0.39 | 11.92 | 12.17 | 95.98 | 24.06 | 2.44 |
| \(X_2\) | 31.40 – 107.97 | 53.44 ± 0.56 | 36.68 | 36.72 | 99.75 | 75.46 | 1.83 |
| \(X_3\) | 4.27 – 12.13 | 5.85 ± 0.20 | 34.67 | 35.15 | 97.28 | 70.45 | 5.79 |
| \(X_4\) | 9.96 – 50.93 | 24.54 ± 0.69 | 37.47 | 37.78 | 98.34 | 76.54 | 4.87 |
| \(X_5\) | 1.82 – 2.26 | 2.01 ± 0.02 | 5.15 | 5.57 | 85.50 | 9.82 | 2.12 |
| \(X_6\) | 4.00 – 8.00 | 4.05 ± 0.00 | 7.81 | 7.81 | 100.00 | 16.08 | 0.00 |
| \(X_7\) | 3.11 – 3.21 | 3.15 ± 0.02 | 0.91 | 0.97 | 88.30 | 1.76 | 1.04 |
| \(X_8\) | 1.35 – 7.02 | 3.47 ± 0.08 | 34.48 | 34.71 | 98.69 | 70.56 | 3.97 |
| \(X_9\) | 45.53 – 50.17 | 48.65 ± 0.24 | 2.10 | 2.26 | 85.87 | 4.01 | 0.85 |
In Table 3, the characters denoted by \(X_1\) to \(X_9\) are:
\(X_1\) – Days to flowering
\(X_2\) – Plant height (cm)
\(X_3\) – Number of branches per plant
\(X_4\) – Number of capsules per plant
\(X_5\) – Capsule length (cm)
\(X_6\) – Number of locules per capsule
\(X_7\) – 1000-seed weight (g)
\(X_8\) – Seed yield per plant (g)
\(X_9\) – Oil content (%)
Genetic parameters include:
Genotypic coefficient of variation (GCV), Phenotypic coefficient of variation (PCV), Broad-sense heritability (\(h^2\)), Genetic advance as percentage of mean (GA), Environmental coefficient of variation (ECV), and Standard error (SE).
Considerable variation was observed across all studied traits. Days to flowering ranged from 18.73 days (KYM-1) to 34.8 days (Tilarani) with a mean of 27.35 days. Plant height showed extensive variation from 31.40 cm (IVTS-06-12) to 107.97 cm (Soma), averaging 53.44 cm. Seed yield per plant, the most variable trait, ranged from 1.35g (IVTS-06-22) to 7.02g (SVPR-1) with a mean of 3.47g.
The genetic parameters for the traits studied as a part of the experiment are presented in Table 3.
Number of branches per plant (51.83%) and capsules per plant (43.56%) show the highest variability, indicating excellent prospects for selection and breeding. Low variability in 1000-seed weight (2.95%) suggests this trait is more genetically stable across genotypes.
All traits exhibited high broad-sense heritability exceeding 85%. The highest heritability was observed for locules per capsule (100%) followed by plant height (99.75%), seed yield per plant (98.69%), and number of capsules per plant (98.34%).
The significant genetic variation observed across all studied traits provides a robust foundation for sesame breeding programs. High heritability estimates (>85%) for all traits indicate that observed phenotypic variation primarily reflects genetic differences rather than environmental effects, facilitating effective selection strategies (Allard 1960; H. Kumar and Garg 2016). The combination of high heritability with high genetic advance for days to flowering, plant height, number of branches per plant, number of capsules per plant, and seed yield per plant suggests predominant additive gene action, making these traits responsive to simple selection methods (Burton 1952; A. Singh and Chaudhary 2006). Genotypic correlation coefficients generally exceeded phenotypic correlations, indicating strong genetic associations among traits. Seed yield per plant showed significant positive correlations with days to flowering (\(r = 0.321^{*}\)), plant height (\(r = 0.633^{**}\)), number of branches per plant (\(r = 0.552^{**}\)), number of capsules per plant (\(r = 0.956^{**}\)), locules per capsule (\(r = 0.312^{*}\)), and oil content (\(r = 0.438^{**}\)).
| Trait | \(X_1\) | \(X_2\) | \(X_3\) | \(X_4\) | \(X_5\) |
|---|---|---|---|---|---|
| \(X_1\) | 1.000 | 0.956** | 0.633** | 0.552** | 0.438** |
| \(X_2\) | 0.956** | 1.000 | 0.625** | 0.683** | 0.423** |
| \(X_3\) | 0.633** | 0.625** | 1.000 | 0.582** | 0.491** |
| \(X_4\) | 0.552** | 0.683** | 0.582** | 1.000 | 0.367* |
| \(X_5\) | 0.438** | 0.423** | 0.491** | 0.367* | 1.000 |
In Table 4, the traits denoted by \(X_1\) to \(X_5\) are:
\(X_1\) – Seed yield per plant (g)
\(X_2\) – Number of capsules per plant
\(X_3\) – Plant height (cm)
\(X_4\) – Number of branches per plant
\(X_5\) – Oil content (%) Correlation significance: p < 0.05 (), p* < 0.01 (**)
Number of capsules per plant shows the strongest positive correlation with seed yield (\(r = 0.956^{**}\)), making it the most reliable indirect selection criterion. Plant height and branches per plant also show strong positive associations, indicating coordinated plant architecture development. The strong positive correlation between number of capsules per plant and seed yield (\(r = 0.956^{**}\)) confirms this trait as the most reliable selection criterion for yield improvement.
| Trait | Direct Effect | \(X_1\) | \(X_2\) | \(X_3\) | \(X_4\) | \(X_5\) | \(X_6\) | \(X_7\) | Total Correlation |
|---|---|---|---|---|---|---|---|---|---|
| \(X_1\) | -0.108 | – | -0.016 | -0.070 | 0.453 | -0.032 | 0.001 | -0.004 | 0.321 |
| \(X_2\) | 0.077 | -0.023 | – | -0.136 | 0.698 | 0.027 | -0.011 | 0.001 | 0.633 |
| \(X_3\) | -0.231 | -0.032 | 0.046 | – | 0.769 | 0.008 | -0.008 | 0.000 | 0.552 |
| \(X_4\) | 1.106 | -0.044 | 0.049 | -0.160 | – | 0.016 | -0.009 | -0.002 | 0.956 |
| \(X_5\) | 0.106 | -0.033 | 0.019 | -0.016 | 0.169 | – | -0.004 | -0.002 | 0.240 |
| \(X_6\) | 0.022 | -0.069 | -0.004 | 0.019 | 0.109 | -0.011 | – | 0.004 | 0.109 |
| \(X_7\) | -0.020 | -0.004 | 0.041 | -0.093 | 0.512 | 0.021 | 0.054 | – | 0.469 |
In Table 5, the traits denoted by \(X_1\) to \(X_7\) are: \(X_1\) – Days to flowering
\(X_2\) – Plant height (cm)
\(X_3\) – Number of branches per plant
\(X_4\) – Number of capsules per plant
\(X_5\) – Capsule length (cm)
\(X_6\) – 1000-seed weight (g)
\(X_7\) – Oil content (%)
Path analysis as depicted in Table 5 revealed that number of capsules per plant exerted the highest positive direct effect (1.106) on seed yield per plant, followed by capsule length (0.106), plant height (0.077), and 1000-seed weight (0.022). Conversely, number of branches per plant showed the highest negative direct effect (-0.231), followed by days to flowering (-0.108) and oil content (-0.020). The residual effect was 0.203, indicating that approximately 80% of variation in seed yield was explained by the studied traits. The negative direct effect of branches per plant (\(-0.231\)) despite positive correlation suggests indirect benefits through increased capsule production. Plant height contributes mainly through indirect effects via capsule production. The analysis explains 79.66% of yield variation, indicating good model adequacy.
3.1 Genetic divergence analysis
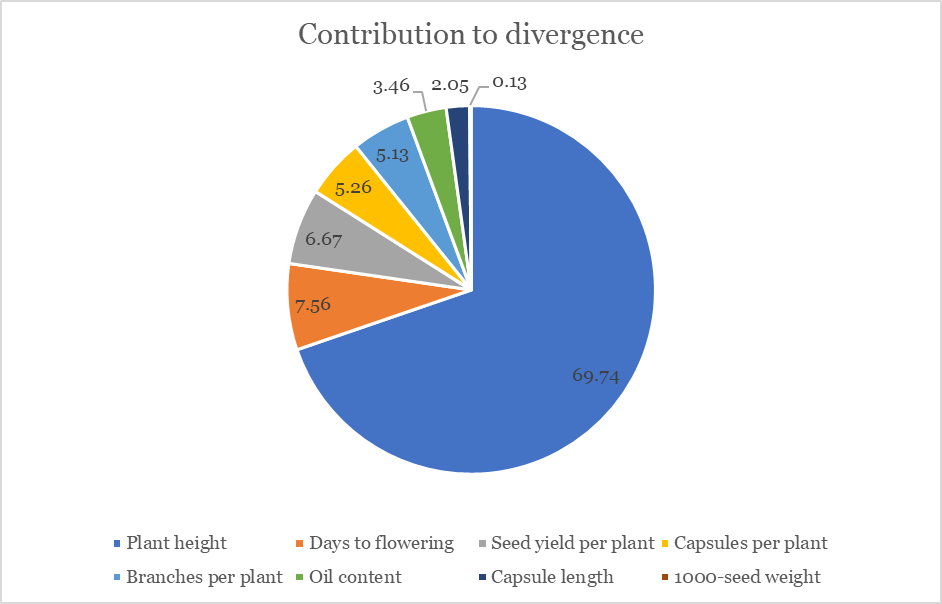
Mahalanobis \(D^2\) analysis revealed that plant height contributed maximum to total divergence (69.74%), followed by days to flowering (7.56%) and seed yield per plant (6.67%). This indicates plant height as the primary discriminating factor among genotypes.
Plant height is the major contributor to genetic divergence among sesame genotypes, followed by flowering time and seed yield components as depicted in Figure 1.
3.2 Cluster analysis
The 40 genotypes were grouped into six distinct clusters. Cluster I was the largest with 30 genotypes, while Clusters III, IV, V, and VI each contained single genotypes. Maximum inter-cluster distance was observed between Clusters III and IV (\(D^2\) = 75.04), indicating maximum genetic divergence between these groups.
| Cluster | Genotypes | Total Number of Genotypes |
|---|---|---|
| I | IVTS-06-2, IVTS-06-3, YLM-17, AVTS-06-6, TCR-4865, TCR-3105, VRI-2, IVTS-06-16, IVTS-06-8, AVTS-06-10, TCR-2527-C, IVTS-06-15, AVTS-06-5, AVTS-06-4, IVTS-06-6, AVTS-06-3, AVTS-06-7, AVTS-06-1, AVTS-06-1, IVTS-06-28, IVTS-06-27, IVTS-06-13, TCR-2511, IVTS-06-12, TCR-3279-A, TMV-4, TMV-5, IVTS-06-26, TMV-6, VRI-1 | 30 |
| II | Tilatara, CO-1, Tilak, Tilarani, TMV-3, Surya | 6 |
| III | IVTS-06-22 | 1 |
| IV | Soma | 1 |
| V | SVPR-1 | 1 |
| VI | KYM-1 | 1 |
Cluster means revealed distinct patterns across groups which are represented in Table 7 Cluster VI (KYM-1) showed the earliest flowering (18.73 days) and highest oil content (50.17%), while Cluster IV (Soma) exhibited the tallest plants (107.97 cm) and maximum branches per plant (10.80). Cluster V (SVPR-1) demonstrated the highest seed yield per plant (7.02g).
| Character | Cluster I | Cluster II | Cluster III | Cluster IV | Cluster V | Cluster VI |
|---|---|---|---|---|---|---|
| Days to flowering | 27.17 | 30.77 | 21.41 | 25.73 | 28.13 | 18.73 |
| Plant height (cm) | 44.13 | 81.58 | 61.33 | 107.97 | 59.30 | 95.60 |
| Branches per plant | 5.20 | 8.39 | 7.34 | 10.80 | 4.73 | 5.00 |
| Capsules per plant | 21.42 | 36.07 | 9.96 | 41.20 | 45.43 | 26.07 |
| Seed yield per plant (g) | 3.07 | 4.59 | 1.36 | 5.77 | 7.02 | 4.79 |
| Oil content (%) | 48.35 | 49.54 | 49.33 | 49.23 | 49.53 | 50.17 |
The clustering of genotypes from the same geographical origin into different groups confirms that genetic drift and selection pressure can create greater diversity than geographical separation (Pandey et al. (2015); S. Singh et al. (2020)). This finding has important implications for breeding programs, suggesting that local germplasm may harbor unexploited genetic diversity.
Cluster V (SVPR-1) shows highest yield potential, Cluster IV (Soma) exhibits superior plant architecture, and Cluster VI (KYM-1) offers early maturity with high oil content. Strategic crosses between distant clusters (III × IV) could maximize genetic variation in breeding populations.
Recent molecular diversity studies using SNP markers have corroborated these findings. Wang et al. (2016) analyzed 705 sesame accessions using genome-wide SNPs and found similar clustering patterns, with genetic diversity being more strongly associated with breeding history than geographical origin. The maximum divergence between Clusters III and IV (\(D^2 = 75.04\)) in our study corresponds to regions of low genetic similarity identified in genomic studies (Dossa et al. 2017).
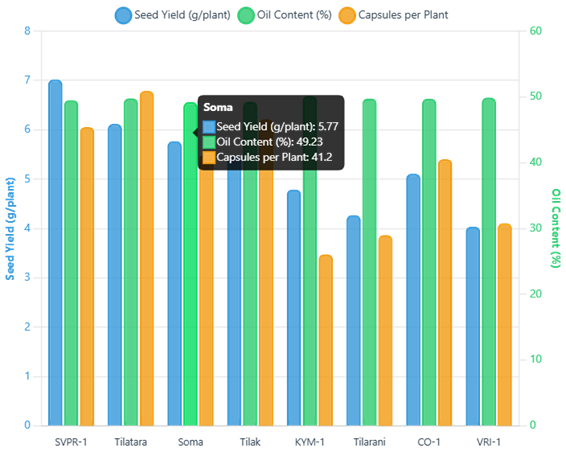
Based on comprehensive evaluation, several genotypes emerged as superior performers across multiple traits as depicted Figure 2. SVPR-1 demonstrated the highest seed yield (7.02 g/plant), while KYM-1 showed the earliest flowering and highest oil content. Soma exhibited exceptional plant architecture with maximum height and branching.
Discussion
The combination of high heritability with high genetic advance for days to flowering, plant height, number of branches per plant, number of capsules per plant, and seed yield per plant suggests predominant additive gene action, making these traits responsive to simple selection methods (Burton 1952; A. Singh and Chaudhary 2006). These findings align with recent reports by Gangwar et al. (2021), Ahmad et al. (2020), and Yahaya et al. (2021), who observed similar patterns in diverse sesame germplasm collections.
The strong positive correlation between number of capsules per plant and seed yield (\(r = 0.9558^{**}\)) confirms this trait as the most reliable selection criterion for yield improvement. Path analysis further substantiated this relationship by revealing the highest direct effect (1.1063) of capsule number on seed yield. Similar findings have been reported in recent studies by R. Kumar et al. (2019), Gangwar et al. (2021), and Ahmad et al. (2020). The characters plant height, branches per plant, capsules per plant, and oil content showed significant and positive association with seed yield per plant. Therefore, simultaneous improvement of seed yield may be possible through selection of these characters. These matched the reports and conclusions of V. Kumar et al. (2022) and Patel et al. (2023).
Modern breeding programs increasingly utilize these correlation patterns in genomic prediction models. Zhang et al. (2013) demonstrated that incorporating trait correlations into genomic selection algorithms improved prediction accuracy for seed yield by 25% compared to single-trait models. The strong genetic correlations observed in our study suggest that multi-trait selection indices could be particularly effective in sesame breeding (Yu et al. 2019).
Murthy and Kulkarni (1996) explained that wide adaptability of divergent types could be possible due to factors such as heterogeneity, genetic architecture of the populations, past history of selection, developmental factors, and degree of general combining ability. In the present study, varieties developed at the same location were found to be grouped in different clusters, indicating more divergence. For example, sesame varieties from Kerala Agricultural University were found to be grouped in Clusters II, IV, and VI. This confirms the earlier findings of Raut et al. (1991) that genetic drift and human selection could cause greater diversity than geographical spacing.
Angadi (1976) reported that varieties in a cluster with a high order of divergence among themselves would be the best breeding materials for achieving maximum genetic advance with regard to yield. Selection within a cluster might also be exercised based on the highest mean performance of the varieties for desirable traits such as seed yield.
Conclusion
This comprehensive genetic analysis of 40 sesame genotypes revealed substantial genetic variability suitable for breeding programs. High heritability estimates coupled with significant genetic advance indicate favorable prospects for genetic improvement through selection. Number of capsules per plant emerged as the most critical trait for yield improvement, while genetic divergence analysis identified optimal parent combinations for hybridization programs.
The identification of genetically divergent clusters provides a scientific basis for systematic breeding approaches. Integration of conventional breeding with molecular markers and genomic selection offers promising avenues for accelerating genetic gains. Future breeding efforts should prioritize crosses between genotypes from distant clusters while maintaining focus on high-performing individuals within clusters.
The superior genotypes identified in this study (SVPR-1, Soma, KYM-1, and Tilatara) represent valuable genetic resources for developing climate-resilient varieties with enhanced yield potential and oil quality. This research establishes a foundation for modern sesame breeding programs, contributing to the revival of this ancient yet underutilized crop in the context of sustainable agriculture and food security.
References
Publication Information
- Submitted: 15 June 2025
- Accepted: 24 June 2025
- Published (Online): 24 June 2025
Reviewer Information
Reviewer 1:
AnonymousReviewer 2:
Dr. Lovely B.
Department of Plant Breeding & Genetics
College of Agriculture, Vellayani
Kerala Agricultural University