RAISINS: Integrating R and AI for Agricultural Data Analysis

RAISINS (R and AI Solutions for INferential Statistics) is a web-based statistical analysis platform designed to bridge the gap between complex inferential methods and the practical needs of students and researchers, particularly in the agricultural sciences. By integrating the computational power of R and Python with the adaptive capabilities of OpenAI’s artificial intelligence APIs, RAISINS delivers an intuitive, code-free interface for performing advanced statistical analyses. Hosted on Posit Connect Cloud, the platform eliminates the need for local software installation, enabling seamless, browser-based access to a wide range of statistical tools. RAISINS simplifies model building, result interpretation, and reporting, making it especially valuable for non-statisticians and early-career researchers seeking reliable insights from agricultural data.
Data Analysis, Agriculture Research, Design of Experiments, Statistical Genetics, Social Sciences, Open AI, Python, R
![]()
![]()
![]()
1 Introduction
Statistical analysis serves as the backbone of scientific research, especially in disciplines like agriculture, where field experiments, survey data, and observational studies generate complex datasets. Despite the increasing emphasis on data-driven decision-making in agricultural research, many students, early-career researchers, and practitioners find themselves at a disadvantage when it comes to performing rigorous statistical analyses. The process is often hindered by a combination of factors: the steep learning curve associated with programming languages such as R and Python, the fragmented nature of statistical learning resources, and the lack of user-friendly tools tailored to agricultural research contexts.
While R and Python are powerful, flexible, and widely adopted in academic and professional settings, their command-line interfaces and syntax-heavy operations can be challenging for those without formal training in statistics or computer programming. Beginners frequently struggle with package selection, data cleaning, model specification, and interpretation of results. Furthermore, existing statistical software either lacks the flexibility and transparency of open-source tools or comes with licensing restrictions and high costs that limit accessibility in resource-constrained settings, particularly in developing countries.
In addition, agricultural research involves domain-specific needs such as handling experimental designs (e.g., CRD, RBD, split-plot), analyzing agronomic trials, processing survey data with appropriate sampling designs, and interpreting interactions between multiple environmental and genetic factors. Traditional statistical packages are not always well-adapted to these specific requirements, leaving researchers to either customize solutions on their own or consult specialists — both of which can delay or compromise the analytical workflow.
To bridge this gap, we developed RAISINS (R and AI Solutions for INferential Statistics) — a web-based platform designed to simplify and democratize statistical analysis for agricultural research. RAISINS integrates the power of R, Python, and AI-driven assistance within an intuitive interface that eliminates the need for code-based interaction. By abstracting complex syntax and offering guided, step-by-step workflows for data upload, analysis, visualization, and interpretation, the platform empowers users to focus on scientific inquiry rather than technical execution.
Built on open-source technologies and scalable cloud infrastructure, RAISINS provides modules for commonly used statistical methods — including descriptive analysis, hypothesis testing, regression models, design of experiments, multi environmental trials, and more — while incorporating AI tools that assist in data summarization, analytical suggestions, and natural language explanations of results. This makes it an ideal solution for students, researchers, extension personnel, and educators engaged in agricultural and allied sciences. RAISINS can be accessed online through its official web portal at https://www.raisins.live/.
In this paper, we present the design, features, and use-cases of RAISINS, and demonstrate how it addresses the unique challenges faced in agricultural data analysis by offering an accessible, robust, and intelligent statistical platform.
2 Materials and methods
2.1 Platform architecture and module validation
RAISINS is a modular cloud-hosted, web-based platform that integrates statistical computing, artificial intelligence, and modern pedagogical design to serve agricultural researchers and students. Built using R, Python, and OpenAI APIs, RAISINS is deployed via Posit Connect Cloud (https://connect.posit.cloud/), enabling browser-based access without requiring any local software installation. The RAISINS platform is modular and each statistical tool within is aligned with the theoretical underpinnings found in globally recognized academic literature.
All modules in RAISINS have been peer-reviewed by domain experts, including statisticians specializing in design of experiments, genetics, and social science research. This ensures both methodological rigor and instructional clarity.
Table 1 presents the major analytical domains addressed by RAISINS, the foundational academic references supporting each module domain, organized by area of application.
| Module Domain | Theoretical Foundation |
|---|---|
| Design & Analysis of Experiments | Montgomery (2017) (Montgomery 2017); Gomez & Gomez (1984) (Gomez and Gomez 1984); Das & Giri (2018) (Das and Giri 2018); Searle (1997) (Searle 1997); Dey (1986) (Dey 1986); Cox & Reid (2000) (Cox and Reid 2000); Toutenburg & Shalabh (2009) (Toutenburg and Shalabh 2009); Cochran & Cox (1957) (Cochran and Cox 1957); ; Federer (1985) (Federer 1985) |
| Statistical Genetics | Falconer & Mackay (1996) (Falconer and Mackay 1996); Lynch & Walsh (1998) (Lynch and Walsh 1998); Dabholkar (1999) (Dabholkar 1999); Gillespie (2004) (Gillespie 2004) |
| Social Science Research | Babbie (2020) (Babbie 2020); Bryman (2016) (Bryman 2016); Bhattacherjee (2012) (Bhattacherjee 2012) |
| Statistical Inference and Modeling | Casella & Berger (2002) (Casella and Berger 2002); Hogg, McKean & Craig (2018) (Hogg, McKean, and Craig 2018); Agresti (2013) (Agresti 2013); Rao (2009) (Rao 2009); Rohatgi (1984) (Rohatgi 1984) |
| Data Visualization & Reporting | Tufte (2001) (Tufte 2001); Cleveland (1993) (Cleveland 1993); Few (2009) (Few 2009) |
The algorithms and workflows integrated into RAISINS are grounded in established statistical theory, drawing extensively from authoritative texts and peer-reviewed literature. In cases where existing computational implementations were unavailable or insufficient, original algorithms were developed in adherence to rigorous theoretical principles. The platform’s design and interface have been iteratively refined based on user-centered feedback from researchers and educators, ensuring methodological soundness and usability consistent with global standards in scientific research and statistical education.
2.2 Packages and Libraries
RAISINS integrates a comprehensive ecosystem of open-source R and Python packages to deliver its core functionalities, encompassing statistical modeling, data visualization, artificial intelligence, and interactive web-based deployment. These packages support the platform’s goal of offering high-level statistical capabilities through an accessible and intuitive interface, particularly beneficial for students and researchers in agricultural sciences.
The R-based architecture of RAISINS is built around the shiny framework (Chang et al. 2024), which enables the development of dynamic, browser-accessible applications. Data manipulation tasks are performed using dplyr (Wickham et al. 2024), tidyr, and data.table, while data visualization is implemented through ggplot2 (Wickham 2023), along with complementary packages such as ggthemes, plotly (Sievert 2023), and ggpattern. For statistical analysis relevant to agricultural experiments and general inference, the platform employs packages including agricolae (Mendiburu 2020), broom (Robinson and Hayes 2024), effectsize, lsr, car, phia, and FactoMineR (Husson et al. 2020). These libraries provide robust support for model fitting, hypothesis testing, effect size estimation, and multivariate analysis.
To enhance user interaction and responsiveness, RAISINS integrates several user interface and usability packages, such as shinyWidgets, shinyalert, shinybusy, shinycustomloader, shinyBS, shinythemes, and colourpicker. The presentation and export of analytical results are managed through tools like rmarkdown, kableExtra, and formattable, ensuring professional and structured output for reports and publications.
The reticulate(Allaire et al. 2024) package serves as a bridge between R and Python, allowing both languages to be used seamlessly within the same analytical workflow. In RAISINS, reticulate enables the platform to call Python functions, use Python libraries, and exchange data objects between R and Python environments. This integration allows the platform to combine R’s interactive capabilities with Python’s strengths in machine learning, statistical modeling, and AI-driven tasks, thereby enhancing both flexibility and functionality.
Python libraries are used to extend the platform’s analytical and AI-driven features. Packages such as pandas (The pandas development team 2024) and numpy (Harris et al. 2020) are employed for efficient data handling, while matplotlib and seaborn support graphical representations. For machine learning and statistical modeling, the platform uses scikit-learn (Pedregosa et al. 2011) and statsmodels (Seabold and Perktold 2010). The openai package enables the integration of language models, facilitating intelligent assistance and automated content generation within the platform.
All R and Python packages used in RAISINS are well-maintained, community-supported, and widely recognized within academic and applied data science contexts. Each library is carefully selected based on its performance, stability, and relevance to agricultural research workflows. Modules are thoroughly reviewed by subject-matter experts to ensure methodological accuracy and pedagogical effectiveness, thereby maintaining the platform’s commitment to reproducibility, transparency, and educational value.
3 Illustrations
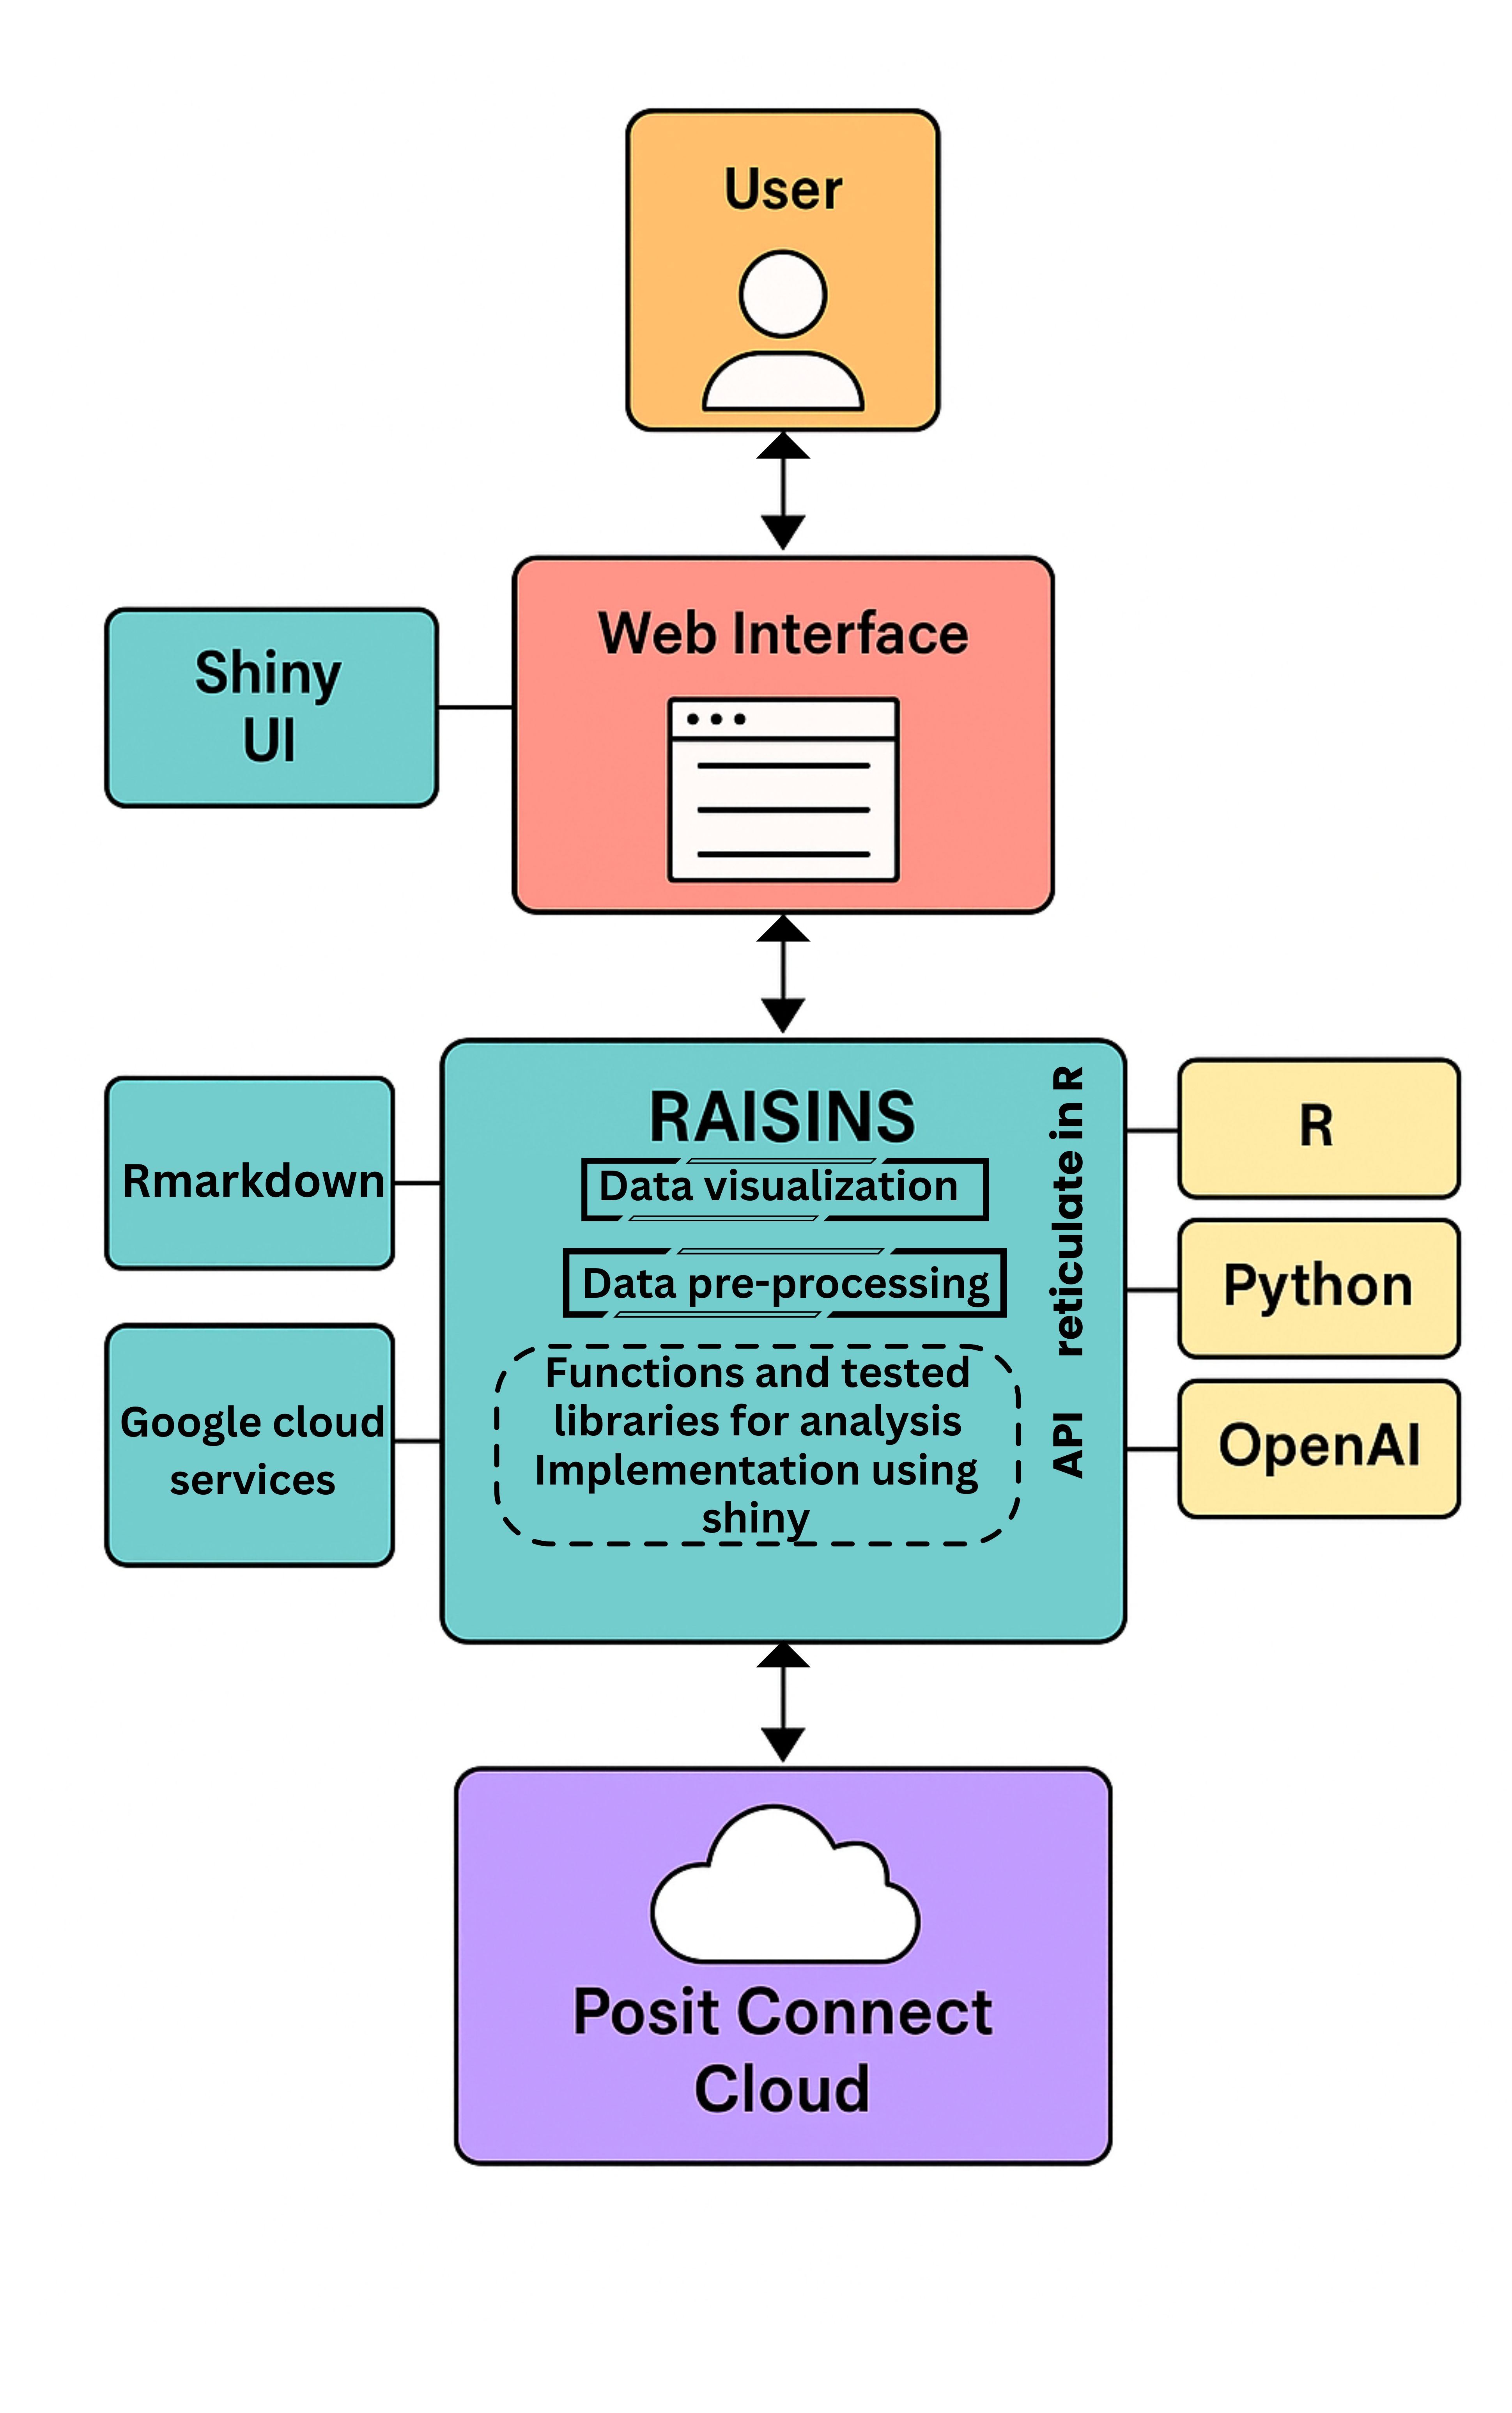
The Figure 1 illustrates the comprehensive architecture of the RAISINS platform, highlighting its integration of multiple programming languages and technologies. RAISINS combines the statistical computing power of R with the flexibility of Python and the advanced capabilities of AI through OpenAI models. The platform’s user interface is built using Shiny, providing an interactive and user-friendly experience, while the backend seamlessly coordinates R and Python processes. Hosting on Posit Connect Cloud ensures reliable accessibility and scalability for agricultural researchers. This integrated ecosystem enables efficient and robust inferential statistical analysis tailored specifically for agricultural research needs.
4 Results
The RAISINS platform was developed to address the growing need for accessible, reliable, and AI-enhanced statistical tools tailored to agricultural research. By integrating familiar programming environments with user-friendly interfaces, it aims to bridge the gap between complex statistical methods and researchers’ practical needs.
4.1 Modular structure and user interface design
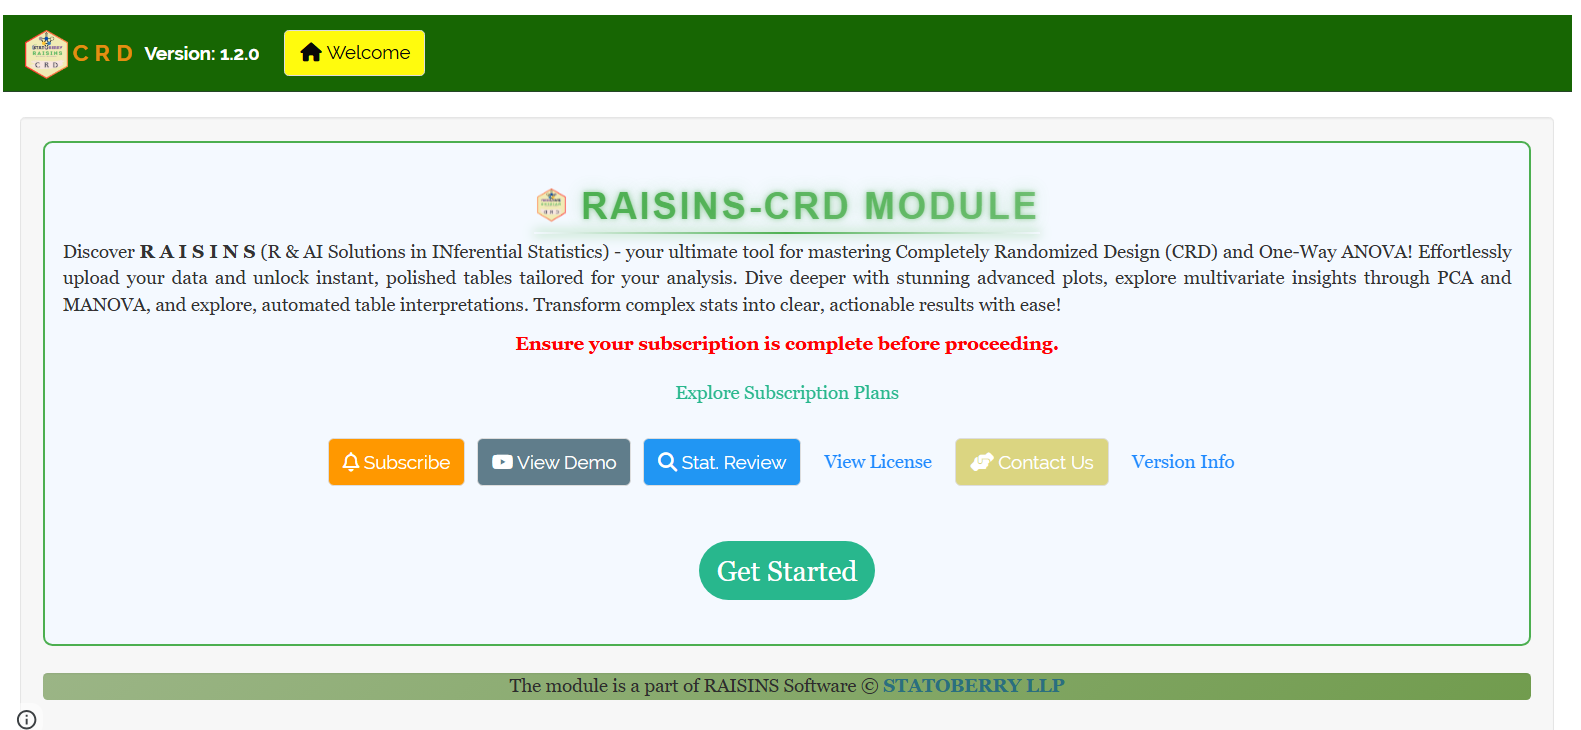
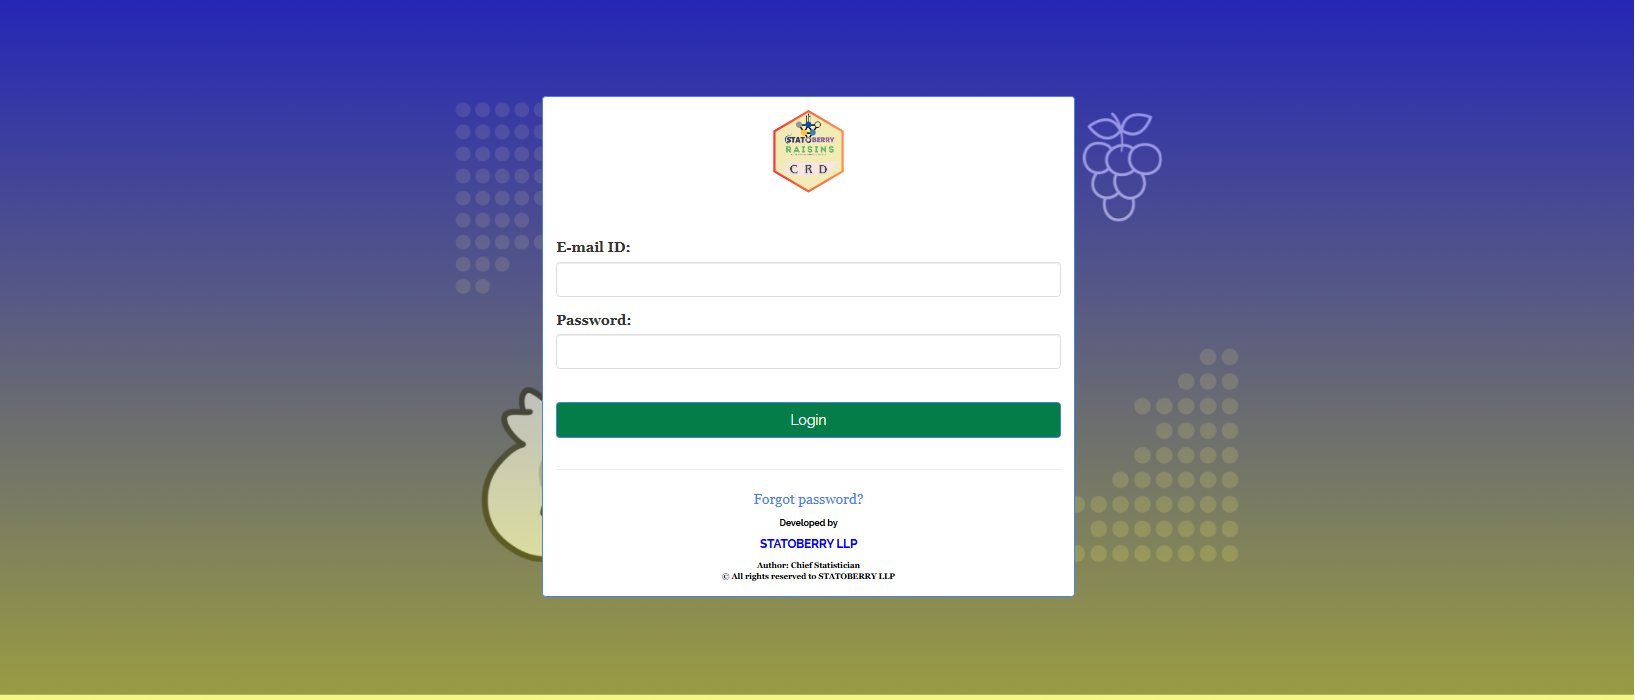
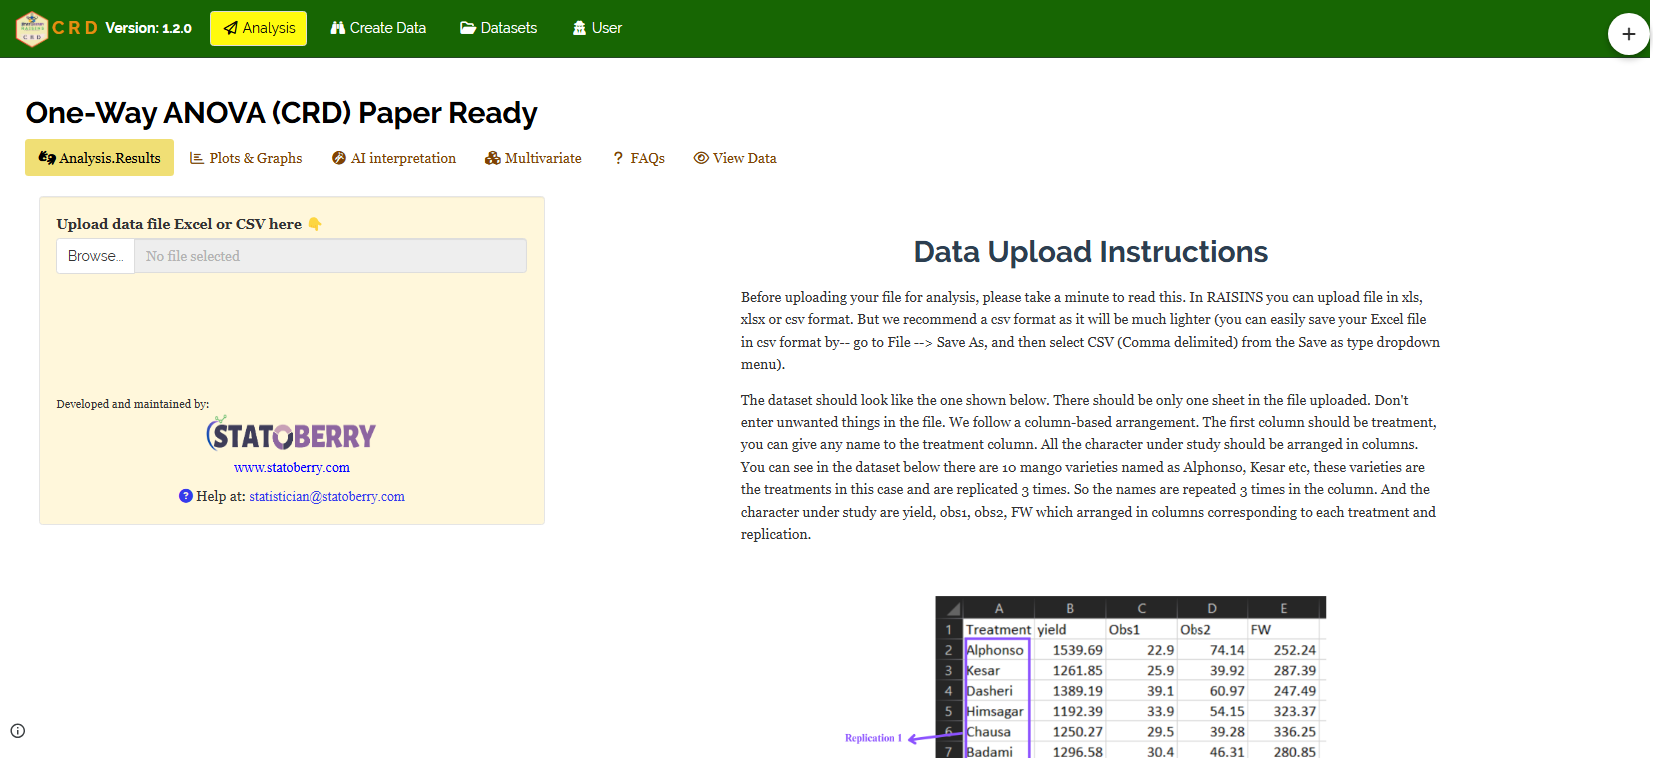
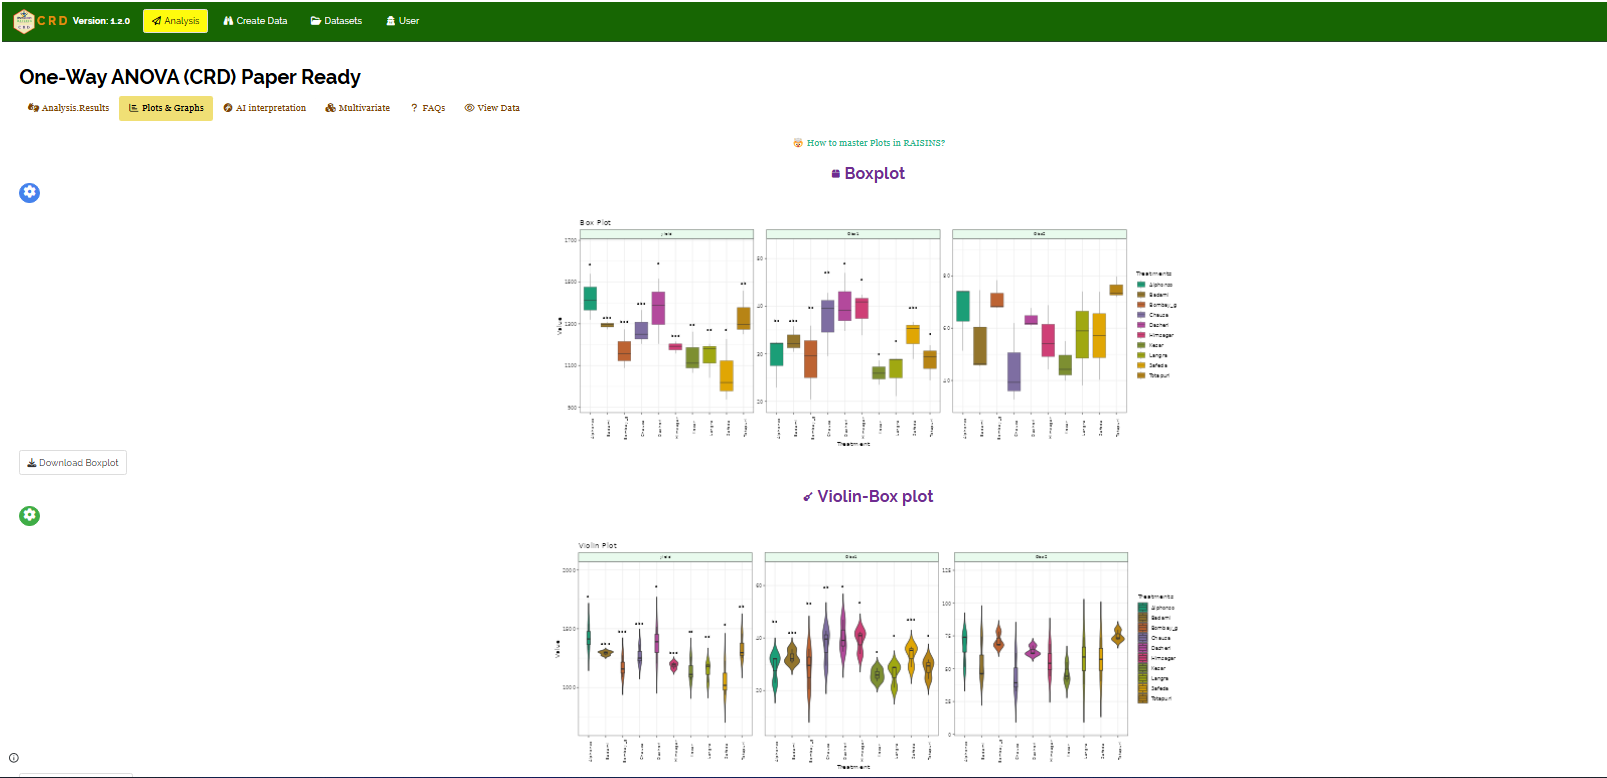
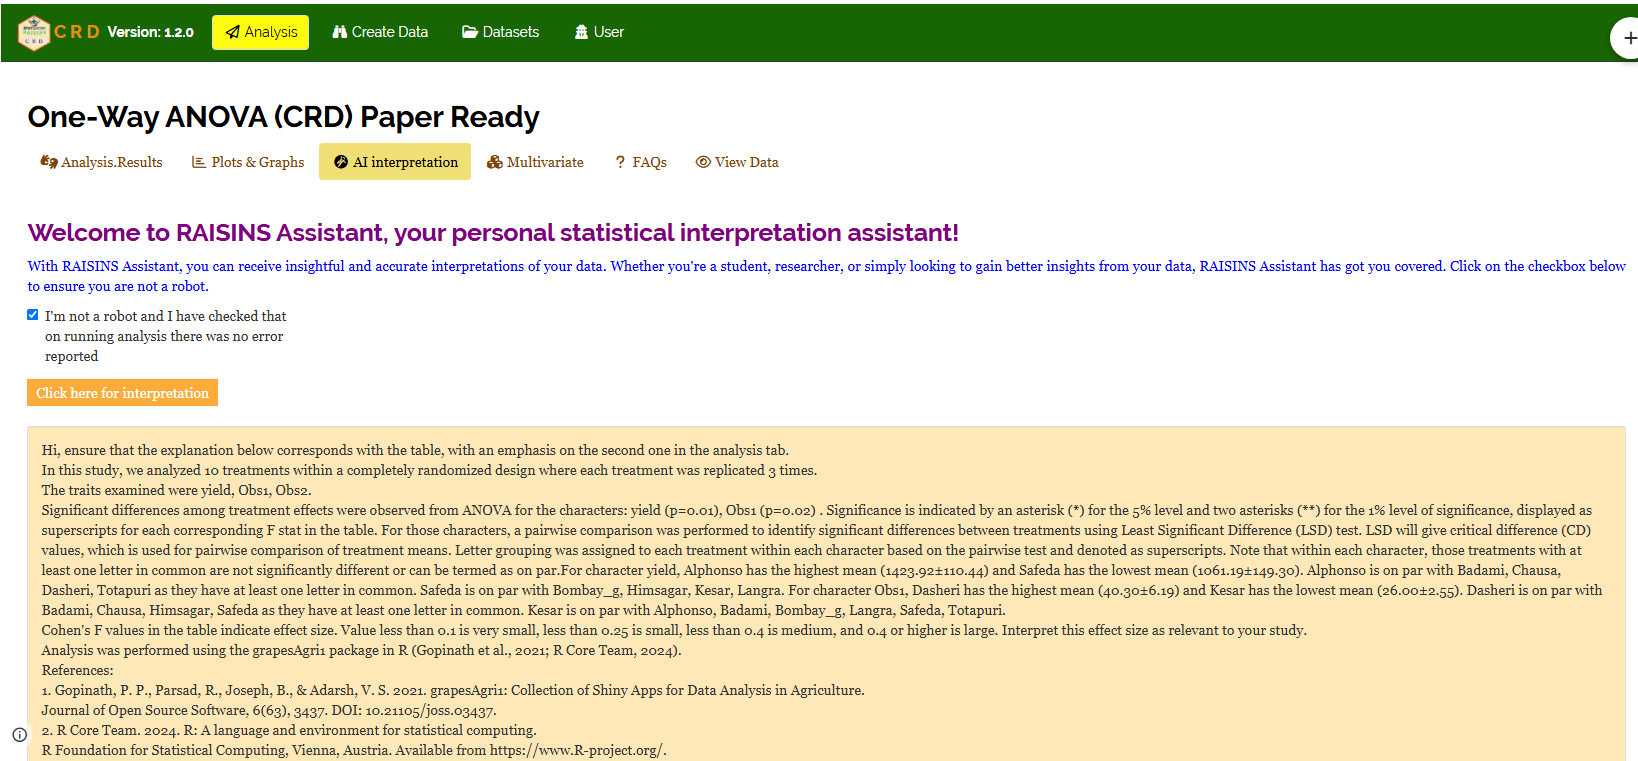
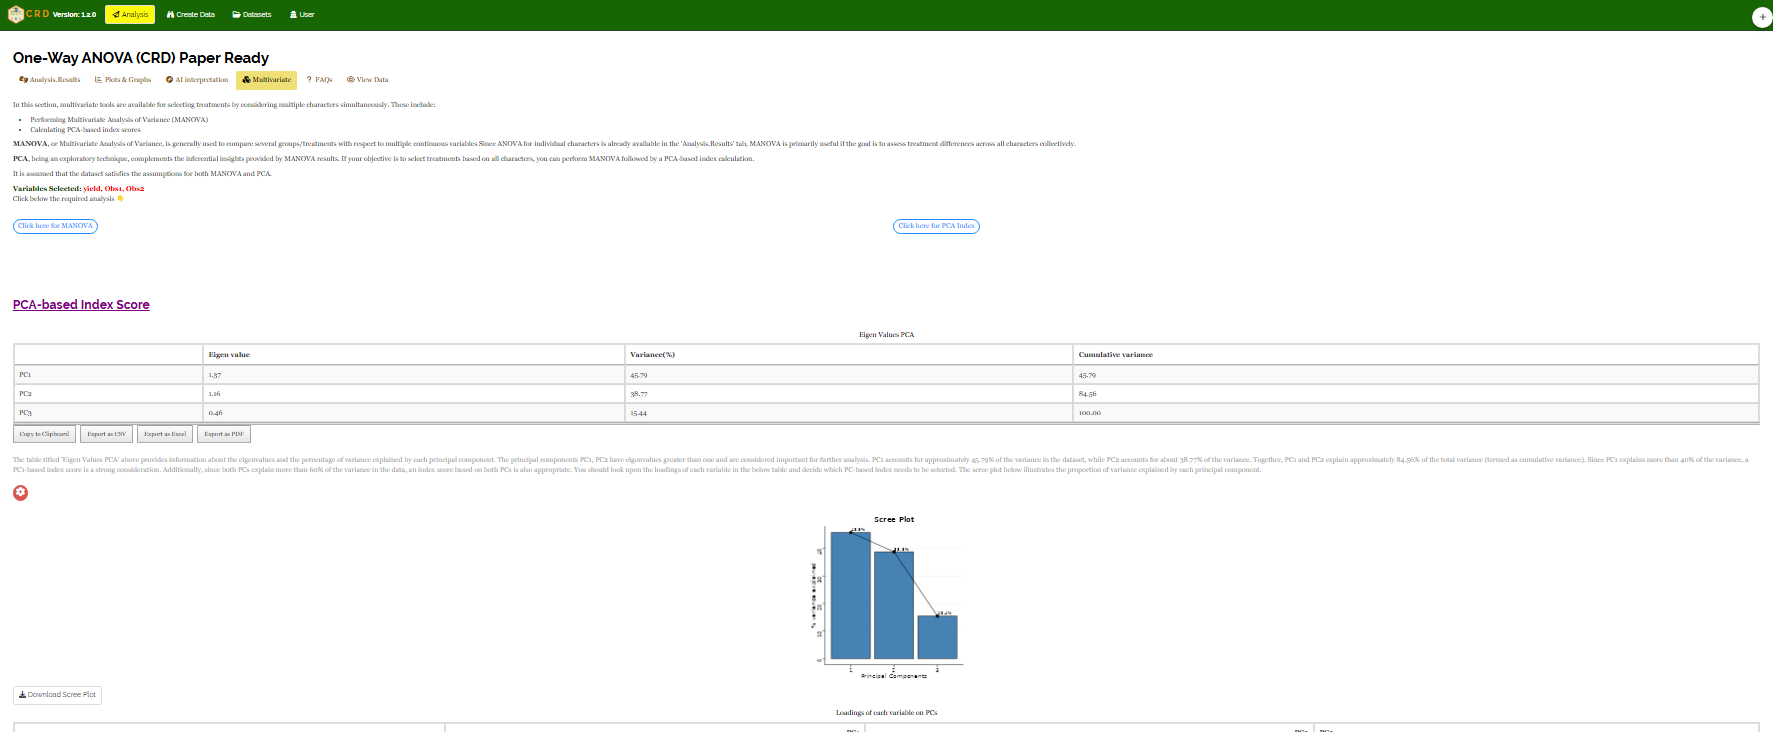
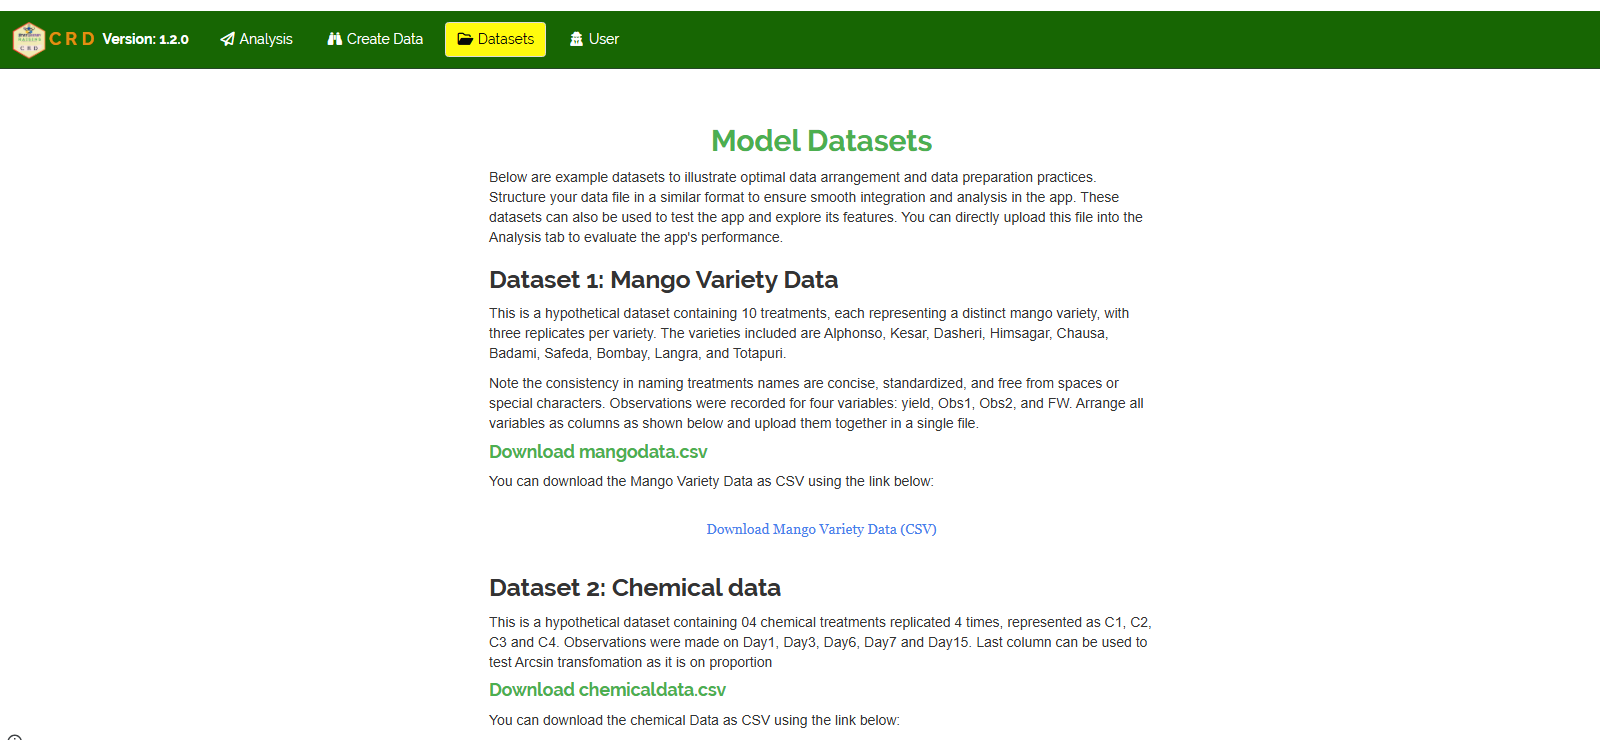
All analytical modules within the RAISINS platform adhere to a standardized structural layout, ensuring a uniform user experience across various statistical tools. Each module features a primary Analysis tab, which serves as the central workspace. This tab contains nested sub-tabs including Analysis.Results, where users configure model parameters and run statistical procedures; Plots and Graphs, which displays dynamic visualizations; AI Interpretation, where OpenAI-assisted textual summaries explain the results in plain language; and, where applicable, a Multivariate tab offering additional multivariate diagnostics and tests. Supplementing the core analysis, additional top-level tabs include Create Data, which enables users to generate CSV-format datasets for custom input; Datasets, which provides curated example datasets for testing and exploration; and User, where authenticated users can access their profile information and session history. For illustration purposes, selected screenshots from the CRD (Completely Randomized Design) module are presented in Figure 2 to demonstrate the consistent tab layout and modular design adopted throughout the platform. A comprehensive module-wise user guide is available at: https://statoberrypapaya.github.io/RAISINS_TUTORIAL/, providing detailed documentation of the functionalities implemented in each component of the RAISINS platform.

Discussion
The RAISINS platform represents a significant advancement in making advanced statistical and AI-driven analytical tools accessible to the agricultural research community. By seamlessly integrating R, Python, and AI capabilities within an intuitive web interface, RAISINS addresses common barriers faced by researchers, such as the complexity of statistical software and interpretation of results. The platform’s emphasis on user-friendliness and automation allows researchers, including those with limited statistical training, to perform rigorous data analysis with confidence. This democratization of statistical tools has the potential to improve the quality and reproducibility of agricultural research outputs. Moreover, the cloud-based deployment ensures scalability and continuous availability, enabling broader adoption across diverse educational and research institutions. The collaborative design and integration of multiple programming environments also open avenues for further enhancements, positioning RAISINS as a flexible and evolving resource in the field of agricultural data science.
Conclusion
The RAISINS platform aims in democratizing access to advanced statistical and AI-powered analytical tools tailored specifically for agricultural research. By integrating the strengths of R and Python programming environments with artificial intelligence capabilities, RAISINS offers researchers an intuitive and comprehensive platform for conducting inferential statistics without requiring extensive technical expertise. Its web-based interface, supported by cloud hosting, ensures that users can access powerful data analysis tools anytime and from anywhere, thereby enhancing collaboration and research productivity. The platform’s ability to simplify complex outputs and support diverse user groups—from students to seasoned faculty—has already contributed to improved data analysis quality and research rigor within agricultural universities. RAISINS not only supports robust statistical inference but also fosters greater confidence among users in interpreting and applying results to their scientific inquiries. This positions RAISINS as a foundational resource in agricultural data science with substantial potential for continued growth and impact.
Future Work
Future development of RAISINS will focus on expanding its analytical capabilities to cover a wider range of disciplines within agricultural research, including statistical genetics, survey data analysis, and agricultural economics. In addition, the AI components will be further enhanced by training on domain-specific datasets, enabling the platform to provide more accurate, context-aware insights and recommendations. These enhancements aim to solidify RAISINS as a continuously evolving and essential tool for meeting the diverse and growing needs of the agricultural research community.
Acknowledgments
References
Technical details
Publication Information
- Submitted: 15 May 2025
- Accepted: 06 June 2025
- Published (Online): 09 June 2025
Reviewer Information
Dr. Saurav Guha, Ph.D.
Assistant Professor-cum-Junior Scientist
Department of Statistics, Mathematics & Computer Application
Bihar Agricultural University, Sabour, India
ORCID: 0000-0001-8960-5062
Dr. Manju Mary Paul, Ph.D.
Assistant Professor
Department of Agricultural Statistics
Kerala Agricultural University, Kerala, India