
Reliability and Validity in Agricultural Research: A Shiny App for Non-statisticians
Survey research is essential for understanding attitudes, behaviours, and perceptions across diverse populations, providing the foundation for data-driven decisions and empirical analysis. Researchers often face difficulties in assessing the validity and reliability of survey instruments due to complex statistical procedures, limited access to integrated tools, and the need for multiple software platforms. Read more …
Survey research is essential for understanding attitudes, behaviours, and perceptions across diverse populations, providing the foundation for data-driven decisions and empirical analysis. Researchers often face difficulties in assessing the validity and reliability of survey instruments due to complex statistical procedures, limited access to integrated tools, and the need for multiple software platforms. To address these challenges, a user-friendly web application was developed to simplify and automate the testing of validity and reliability. The application integrates multiple statistical analyses into a single platform, offering real-time computation and graphical result displays for easy interpretation. This design minimises repetitive analyses, enhances efficiency, and supports users with limited statistical expertise. A user satisfaction survey involving 30 participants revealed that 90% were satisfied with the application’s performance, demonstrating its effectiveness in improving the accuracy, consistency, and overall quality of survey-based research.
Questionnaire, Validity, Reliability, Survey research, Agricultural statistics, Social science
![]()
![]()
![]()
1 Introduction
Survey research is a widely used method for collecting quantitative data on human behaviour, attitudes, and opinions. The accuracy of insights derived from surveys largely depends on the quality of the instruments used, particularly the validity and reliability of questionnaires (Carmines and Zeller 1979; Cronbach 1951). Validity ensures that a questionnaire measures the intended construct, while reliability indicates the consistency of measurements over time.
However, assessing these psychometric properties can be challenging, as traditional methods often involve manual calculations or specialised statistical software that may not be readily accessible to all researchers (Pallant 2020). To address this limitation, a user-friendly web application was developed to automate validity and reliability testing, providing real-time feedback through an intuitive interface (Kline 2023) This innovation enables researchers to perform comprehensive psychometric evaluations efficiently, regardless of their statistical expertise.
In applied research contexts such as agriculture, questionnaires are among the most commonly used tools, yet many studies fail to report procedures for assessing validity (31%) and reliability (33%) (Radhakrishna 2007). By automating these assessments, the developed web application reduces measurement errors-such as sampling, selection, and frame errors-thereby improving the precision and consistency of data collection (Singh 2017).
Overall, the web application enhances the methodological rigour of survey research by simplifying complex statistical evaluations, empowering researchers to design reliable and valid instruments, and strengthening the credibility of research outcomes. Its adoption can significantly improve research quality, particularly in developing regions where expertise in psychometric analysis is often limited.
2 Methodology
2.1 Reliability
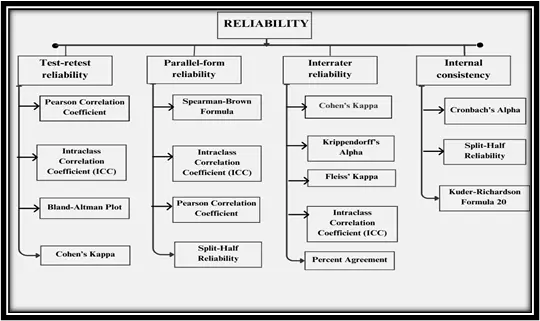
Reliability ensures the consistency and stability of a measurement tool, producing similar results under identical conditions (Nunnally and Bernstein 1994). It underpins the credibility of research by confirming that findings reflect true phenomena rather than measurement errors. Figure 1 categorises reliability into four types: Test-retest, Parallel-form, Interrater, and Internal consistency. Each type includes specific methods such as Pearson Correlation, ICC, Cohen’s Kappa, and Cronbach’s Alpha for assessing consistency. They ensure measurement stability, agreement, and internal accuracy across tests and raters.
Assessing reliability often requires complex statistical calculations and multiple software tools, making it challenging for researchers without strong statistical expertise. Interpreting results like ICC, Cronbach’s Alpha, or Cohen’s Kappa can also be confusing and time-consuming. To overcome these difficulties, this web application was developed to provide an integrated, user-friendly platform that automates reliability testing and simplifies result interpretation.
2.2 Validity
Validity testing ensures that research instruments accurately measure the intended constructs, enhancing the credibility and quality of findings (Cronbach and Meehl 1955). It minimises measurement errors, strengthens reliability, and supports the generalization of results to broader contexts. Using valid tools ensures ethical responsibility, as accurate data lead to meaningful scientific contributions and sound decision-making in applied fields. Validity testing also refines instruments by confirming that each item measures only its intended construct, thereby advancing reliable and theory-based research.
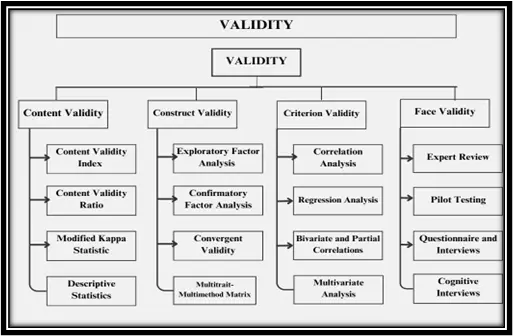
Figure 2 classifies validity into Content, Construct, Criterion, and Face Validity. Each type uses specific methods like EFA, CFA, Correlation Analysis, and Expert Review to ensure instruments measure intended constructs accurately. Together, these tests strengthen measurement accuracy, relevance, and scientific credibility.
Testing validity involves complex statistical methods like EFA, CFA, and correlation analyses, which require advanced statistical knowledge and multiple software tools. Interpreting these results can be time-consuming and confusing for non-experts. To overcome these challenges, this web application was developed to integrate all validity tests into one user-friendly platform, automating analysis and simplifying result interpretation.
2.3 Framework selection
The Shiny was the natural choice for building this application-combining the analytical muscle of R with the sleek interactivity of modern web design (Chang et al. 2023). For researchers diving deep into survey validity and reliability, Shiny offers a powerful toolkit: real-time responsiveness, seamless integration with R’s rich statistical libraries, and effortless web deployment (Beeley 2018). But what truly sets it apart is its flexibility. Whether a seasoned data scientist or a curious newcomer, Shiny makes complex analyses accessible and intuitive (R Core Team 2020). By tailoring the interface to the unique needs of survey-based research, the platform doesn’t just crunch numbers-it tells a story, empowers exploration, and invites insight (Xie, Allaire, and Grolemund 2018).
2.4 Application Architecture
User interface (UI)
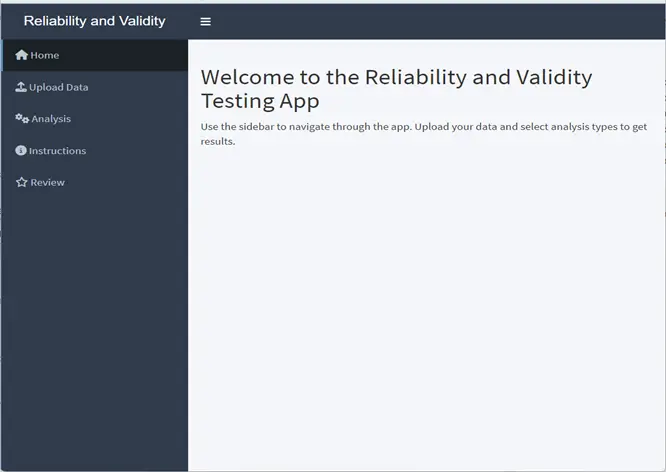
The user interface of the Shiny app was meticulously designed to strike a balance between simplicity and functionality, ensuring that users can navigate the application with ease while accessing powerful analytical tools. The UI is structured into several key sections, as shown in Figure 3.
Data Upload Mechanism
A robust data upload mechanism is a crucial feature of the UI. Users are guided to upload their survey data in CSV format, which the app immediately processes. The application is designed to perform an initial check on the uploaded data, identifying any potential issues such as missing values or formatting errors. This immediate feedback loop allows users to correct problems before they begin their analyses, thereby streamlining the workflow (R Core Team 2020).
Test Selection Interface
The app offers a dropdown menu that categorizes the available tests under broader sections such as “Reliability” and “Validity.” Within these categories, users can further select specific tests like Cronbach’s Alpha, Intraclass Correlation Coefficient (ICC), or Factor Analysis. The structured organization of the test selection process ensures that users can easily find and apply the appropriate tests to their data, regardless of their statistical expertise.
Dynamic Result Display
The results generated by the selected tests are presented in a dynamic and interactive format within the main panel of the UI. Depending on the nature of the test, results may be displayed as tables, graphs, or textual summaries. The UI also provides options for users to download or export these results in various formats, facilitating further analysis or inclusion in research reports. This feature ensures that the application not only performs the necessary calculations but also presents the findings in a clear and usable format (Chang et al. 2023).
Server-side logic
The server component of the Shiny app is where the real power of the application lies. It is responsible for processing the uploaded data and executing the complex statistical analyses required for testing validity and reliability. The server’s architecture follows a systematic workflow:
Data Preprocessing
Once a user uploads their data, the server immediately reads the CSV file into R and conducts a series of preprocessing steps. These include checking for missing data, validating data types, and ensuring that the dataset meets the prerequisites for the selected tests. Such preprocessing safeguards data quality and reduces the likelihood of analytical errors, If any issues are identified, the server communicates these back to the user through the UI, guiding corrections.
Execution of Statistical Tests
The core functionality of the server revolves around performing statistical tests. For reliability testing, this includes calculations for metrics like Cronbach’s Alpha, ICC, and Cohen’s Kappa (Cronbach 1951; Shrout 1998; Fleiss 1971; Cohen 1992). For validity, the server can compute measures such as the Content Validity Ratio (Lawshe 1975) and conduct Factor Analysis. The server is optimised for efficiency, ensuring results are produced quickly, even for large datasets.
Reactive Programming
One of Shiny’s key strengths is its reactive programming model, which the server leverages fully. This model ensures that any changes made by the user-such as selecting different tests, uploading new datasets, or modifying parameters-trigger immediate updates in the displayed results (Chang et al. 2023). This interactivity is essential for fostering an intuitive user experience and enabling researchers to explore different analyses in real time.
Data flow within the application
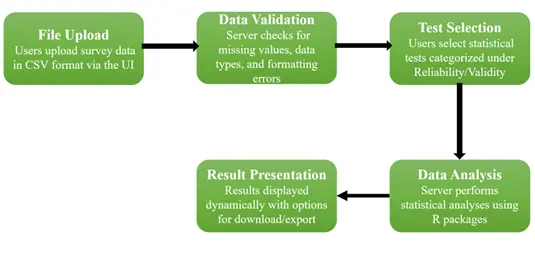
The data flow within the Shiny app is designed to be seamless and efficient, guiding users through the process from data upload to result interpretation in a logical sequence. Figure 4 explains the following steps of the data flow within the application.
File Upload
Users begin by uploading their survey data in a CSV format. The app’s UI facilitates this process, ensuring that users can easily locate and upload their files.
Data Validation
Upon upload, the server automatically validates the data, checking for common issues such as missing values, incorrect data types, or formatting errors. This step is crucial for ensuring that the dataset is ready for analysis.
Test Selection
Once the data is validated, users can select the desired statistical tests from the dropdown menu. The app’s organization of tests under broader categories like “Reliability” and “Validity” makes this process straightforward.
Data Analysis
The server processes the validated data and performs the selected statistical tests. Thanks to R’s powerful statistical packages (Beeley 2018), the app can handle a wide range of analyses, from simple metrics like Cronbach’s Alpha to more complex procedures like Factor Analysis.
Result Presentation
After the analysis is complete, the results are dynamically displayed in the UI. Users can interact with these results, explore different aspects of the data, and even download the findings for further examination or reporting.
This well-orchestrated data flow ensures that users can efficiently conduct their analyses, moving smoothly from one step to the next without unnecessary delays or complications.
3 System Architecture
The architecture of the developed web application follows a client–server model designed for efficient data processing and real-time interaction. The User Interface (UI), built using Shiny’s front-end framework, allows users to upload datasets, select analysis options, and view results. The Server component, implemented in R, handles computation by executing automated reliability and validity analyses, including Cronbach’s alpha and other psychometric tests. Data and results flow dynamically between the UI and server, ensuring quick feedback and seamless operation. The Output module displays the processed results as tables, summary statistics, and downloadable files, enhancing user accessibility and experience. Figure 5 illustrates the overall system flow from user input to result generation.

4 User Gratification Test
To evaluate the developed web application, user gratification was employed as the primary testing construct. User gratification, drawn from psychology and consumer behaviour theories, reflects the satisfaction users experience when interacting with a system (Ruggiero 2000). It provides a holistic framework that incorporates both functional and hedonic dimensions of user experience.
For academic research platforms, gratification is shaped by factors such as ease of use (Davis 1989), trust in results (Gefen, Rigdon, and Straub 2011), aesthetic appeal (Blythe and Hassenzahl 2003), and the extent to which the system meets user requirements. Accordingly, the application was tested across these dimensions to determine its effectiveness in supporting research activities.
A total of 30 participants were selected using convenience sampling, comprising postgraduate students and researchers in agricultural sciences. User gratification was measured using a 5-point Likert scale (1 = Strongly Disagree to 5 = Strongly Agree). The constructs included Technology (2 items), Hedonic (2 items), Risk (2 items), and Behavioural Intention (1 item).
The functional aspects of gratification were assessed by examining accuracy, efficiency, and automation in validity and reliability testing. These features reduce manual effort and save time, directly contributing to user satisfaction. The hedonic aspects, including enjoyment, interactivity, and engagement (Venkatesh and Bala 2008), were also measured, recognising their role in transforming data analysis into a more engaging process.
Specific indicators such as convenience, authenticity of results, user engagement, privacy concerns, and behavioural intentions were incorporated into the evaluation. This ensured that both the technical performance and psychological impact of the system were captured. By adopting user gratification as a testing framework, the study provides insights into how well the application fulfils user expectations and promotes its continued use in academic research.
5 Results
5.1 Results of the Developed Web Application
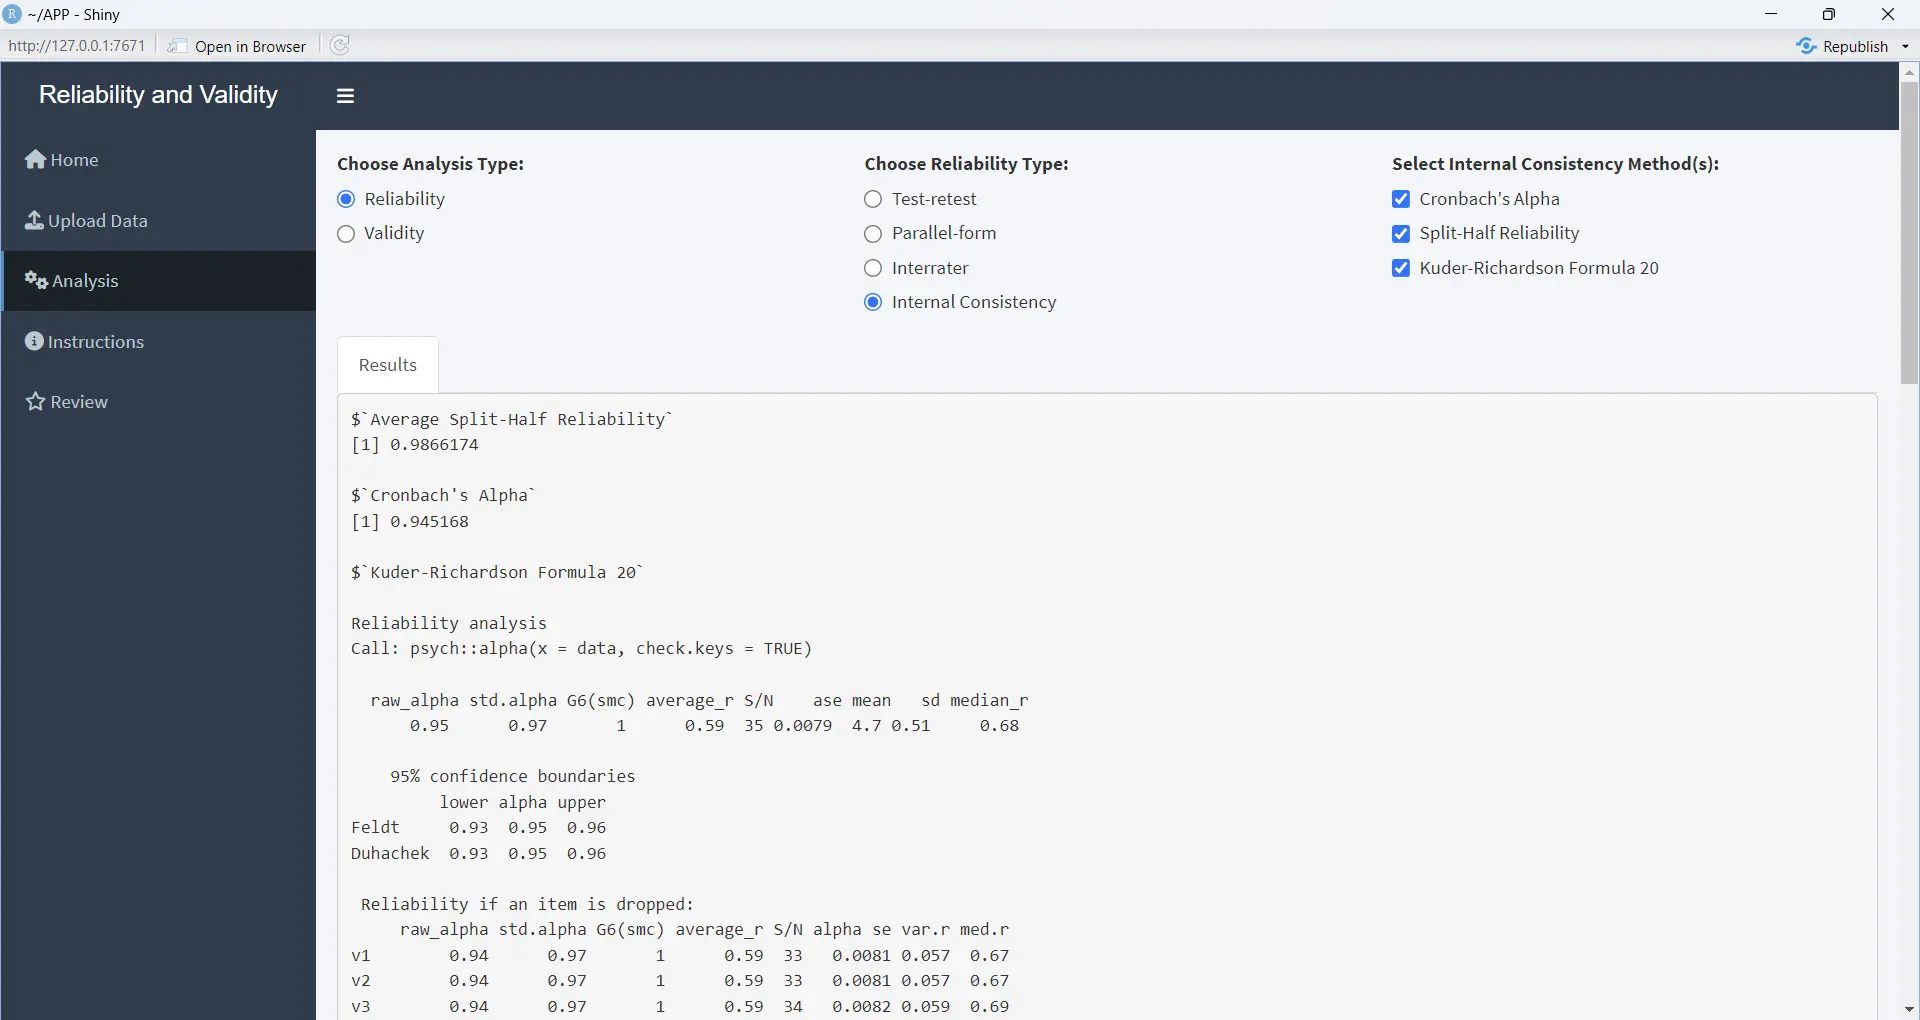
The developed web application demonstrated effectiveness in automating the assessment of validity and reliability for survey instruments. The platform provided real-time feedback through an intuitive interface, eliminating the need for manual computation or advanced statistical software. Application of the tool reduced measurement errors and ensured more accurate data collection. In agricultural research and related fields, the web application enabled systematic reporting of psychometric properties, addressing the prevalent issue of omitted validity and reliability procedures. Overall, the tool enhanced methodological rigour and improved the credibility of research findings, particularly in contexts with limited statistical expertise and resources. Figure 6 shows the Result of the Developed Web Application.
5.2 Reliability Test
The reliability of the user gratification construct was evaluated using Cronbach’s Alpha. Table 1 presents the results for the four key dimensions: technology (convenience), hedonic (enjoyment), risk (privacy concern), and behavioural intention.
All four dimensions demonstrated strong internal consistency. Technology (convenience) showed good reliability (α = 0.80), while hedonic (enjoyment) also indicated good reliability (α = 0.89). Risk (privacy concern) achieved the highest reliability (α = 0.97), reflecting excellent consistency. Behavioral intention was similarly reliable (α = 0.91). The overall scale demonstrated high internal consistency, with Cronbach’s α = 0.91, which is considered acceptable for research instruments.
| Sl. No. | Factors | Reliability (Cronbach’s Alpha) | Status |
|---|---|---|---|
| 1 | Technology (convenience) | 0.80 | Good |
| 2 | Technology (authenticity of conversation) | 0.90 | Good |
| 3 | Hedonic (enjoyment) | 0.89 | Good |
| 4 | Hedonic (pass time) | 0.90 | Good |
| 5 | Risk (Privacy concern) | 0.94 | Good |
| 6 | Risk (immature technology) | 0.92 | Good |
| 7 | Behaviour intention | 0.91 | Good |
| 8 | Statistical capabilities | 0.89 | Good |
| Overall Reliability | 0.91 | Acceptable |
5.3 Factor Analysis
An exploratory factor analysis (EFA) was conducted to examine the dimensionality of the user gratification construct for the web application. Factor loadings are presented in Table 2. Items with loadings above 0.60 were retained as acceptable indicators of their respective factors.
The results indicate strong item loadings across most constructs, with the majority exceeding the recommended threshold of 0.70, confirming convergent validity. The Technology (Authenticity of Conversation) factor showed particularly high loadings (α > 0.81 to 0.92), reflecting the natural and human-like interaction experience provided by the chatbot. Hedonic (Enjoyment) and Hedonic (Pass Time) dimensions also demonstrated high loadings (ranging from 0.76 to 0.91), highlighting the engaging and enjoyable aspects of the application.
Risk-related factors were also significant. Privacy Concerns had high loadings (0.85–0.93), showing that users remain cautious about data security. Similarly, Immature Technology loadings (0.84–0.95) suggested some limitations in system accuracy and responsiveness. Behavioral intention showed relatively lower loadings (0.58–0.75), but still indicated a positive tendency toward future use and recommendation of the chatbot.
These findings confirm that the web application provides gratification both functionally (convenience, authenticity) and hedonically (enjoyment, pass time), while also highlighting areas of concern regarding privacy and system maturity.
| Factors | Loading |
|---|---|
| Technology (Convenience) | |
| The web application makes accessing validity and reliability tests easier. | 0.81 |
| The interface of the web application is user-friendly. | 0.74 |
| Technology (Authenticity of Results) | |
| The web application provides accurate reliability and validity test results. | 0.81 |
| The results from the web application are as reliable as results from other software like SPSS or Mplus. | 0.86 |
| I trust the web application’s accuracy in delivering precise analysis for my survey data. | 0.92 |
| Hedonic (Enjoyment) | |
| I find using the web application for conducting survey research tests enjoyable. | 0.81 |
| Using the web application adds an element of interest to analyzing survey data. | 0.92 |
| The interactive features of the web application allow me to conduct validity and reliability tests anytime and anywhere using the developed web application. | 0.78 |
| Hedonic (Pass Time) | |
| Utilizing the web application is a productive way to spend time on improving survey research quality. | 0.84 |
| Running tests on the web application helps alleviate the stress of manual calculations. | 0.88 |
| I enjoy exploring the web application to enhance my survey research in my free time. | 0.83 |
| Risk (Privacy Concerns) | |
| I am concerned about the privacy of my survey data when using the web application. | 0.91 |
| I feel that the web application might collect too much sensitive information. | 0.93 |
| Using the web application makes me concerned about the security of my uploaded data. | 0.85 |
| Risk (Immature Technology) | |
| The web application sometimes fails to perform all the intended validity and reliability tests. | 0.95 |
| The interface of the web application occasionally crashes or produces vague results. | 0.88 |
| I find that the web application struggles to handle large or complex datasets. | 0.84 |
| Behaviour Intention | |
| I will recommend others to use this web application for testing the reliability and validity of their survey data. | 0.58 |
| I intend to use the web application for all my future survey research tests. | 0.69 |
| I plan to explore more web-based tools and applications like this one for survey data analysis. | 0.75 |
5.4 Regression Analysis
A multiple regression analysis was conducted to examine the influence of six predictors: Technology Convenience, Technology Authenticity, Hedonic Enjoyment, Hedonic Pass Time, Risk Privacy, and Risk Immature Technology-on Behavioural Intention.
The regression model was statistically significant, F(6,24) = 8.07, p < 0.001, indicating that the predictors collectively explained a substantial portion of the variance in Behavioural Intention. The model accounted for 66.9% of the variance (R² = 0.669; Adjusted R² = 0.586). Among the predictors, Technology Authenticity (β = 0.641, p = 0.015) and Hedonic Pass Time (β = 0.421, p = 0.024) had significant positive effects on Behavioural Intention. This suggests that participants who perceived the web application as authentic and those who used it as a meaningful way to pass time were more likely to express stronger behavioural intention to use it. Technology Convenience (β = 0.256, p = 0.082) showed a positive but only marginally significant effect (p < 0.10). Hedonic Enjoyment (β = 0.273, p = 0.412), Risk Privacy (β = 0.031, p = 0.632), and Risk Immature Technology (β = -0.066, p = 0.365) were not significant predictors of Behavioural Intention. Table 3 shows the results of the Regression analysis.
| Variable | Estimate | Std. Error | t value | P-value |
|---|---|---|---|---|
| Intercept | 2.09 | 0.88 | 2.26 | 0.02 * |
| Technology Convenience | 0.25 | 0.15 | 1.71 | 0.08 |
| Technology Authenticity | 0.64 | 0.21 | 3.09 | 0.01 ** |
| Hedonic Enjoyment | 0.27 | 0.24 | 0.73 | 0.41 |
| Hedonic PassTime | 0.42 | 0.18 | 2.15 | 0.02 * |
| Risk Privacy | 0.03 | 0.09 | 0.25 | 0.63 |
| Risk ImmatureTech | -0.06 | 0.11 | 0.64 | 0.36 |
6 Discussion
The developed web application offers an efficient and accessible solution for testing the validity and reliability of questionnaires used in survey research, both essential for ensuring accurate and consistent data collection. By automating reliability estimation, including Cronbach’s alpha, the application enables researchers to evaluate internal consistency rapidly and identify items that may reduce instrument quality.
The validity testing component ensures that each survey item effectively measures its intended construct, thereby minimising measurement errors and improving the overall credibility of research findings. Designed for users with varying levels of statistical expertise, the application simplifies complex psychometric evaluations through a user-friendly, web-based interface.
This online accessibility eliminates the need for specialised software or manual computation, saving time while maintaining methodological rigour. As a result, the application enhances the accuracy and dependability of survey-based studies. In the future, incorporating advanced psychometric features such as Exploratory Factor Analysis (EFA) and Confirmatory Factor Analysis (CFA) could further expand its analytical depth, providing richer insights into questionnaire structure and improving its applicability across diverse research contexts.
7 Conclusion
This web application marks a major advancement in survey research by offering a robust, user-friendly platform for evaluating the validity and reliability of questionnaire instruments. It integrates a wide range of statistical tests, supports diverse data types, and simplifies complex analyses for users of all expertise levels. Automating reliability and validity assessments enhances research accuracy and credibility. Future updates will introduce advanced analytics, machine learning, and seamless integration, while maintaining compatibility with the latest versions of R, Shiny, and other dependencies. Continuous performance monitoring and scalability improvements will ensure it remains a vital tool across research disciplines.
Access the web application for validity and reliability analysis:
Reliability & Validity Web Application
References
Publication Information
- Submitted: 18 October 2025
- Accepted: 31 October 2025
- Published (Online): 01 November 2025
Reviewer Information
Reviewer 1:
Dr. K.Satheesh Kumar Assistant Professor SRM College of Agricultural Sciences SRM Nagar, Kattankulathur, Tamil NaduReviewer 2:
Dr. Dinesh Kumar P Assistant Professor Alliance University Anekal, Bengaluru, Karnataka
The statements, opinions and data contained in all publications are solely those of the individual author(s) and contributor(s) and not of the publisher and/or the editor(s).
The publisher and/or the editor(s) disclaim responsibility for any injury to people or property resulting from any ideas, methods, instructions or products referred to in the content.
© Copyright (2025): Author(s). The licensee is the journal publisher. This is an Open Access article distributed under the terms of the Creative Commons Attribution-NonCommercial-NoDerivatives 4.0 International License, which permits non-commercial use, sharing, and reproduction in any medium, provided the original work is properly cited and no modifications or adaptations are made.