
Best-Worst Scaling in Agricultural Research: A Review of Methods and Applications
Understanding stakeholder preferences is essential for designing effective agricultural policies, promoting technology adoption, and aligning market strategies with consumer demand. Best–Worst Scaling (BWS) is a robust stated preference method Read more …

Understanding stakeholder preferences is essential for designing effective agricultural policies, promoting technology adoption, and aligning market strategies with consumer demand. Best–Worst Scaling (BWS) is a robust stated preference method that captures preferences by choosing the most and least important attributes within a choice set. This review highlights the statistical foundations of BWS, including Random Utility Theory, and common analytical models such as Multinomial Logit, Latent Class Analysis, Random Parameter Logit, and Hierarchical Bayesian frameworks to estimate preference heterogeneity. A bibliometric analysis of BWS applications in agricultural research highlights increasing adoption, publication trends, and leading contributors in the field. The findings reveal that BWS provides actionable insights into consumer and farmer preferences, informing product development, policy formulation, and sustainable decision-making, and demonstrates its growing relevance as a rigorous tool for evidence-based agricultural research.
Best-Worst Scaling, Preference elicitation, Choice models, Consumer choices, Agricultural decision-making
![]()
![]()
![]()
1 Introduction
Agriculture serves as the foundation of global food systems, supporting human sustenance, economic stability, and environmental sustainability. Its effectiveness largely depends on the decisions and preferences of farmers, consumers, and policymakers. Choices such as selecting resilient crop varieties and inputs, implementing sustainable farming practices, and responding to consumer demand influence productivity and yields while shaping ecological outcomes, biodiversity conservation, and the equitable allocation of resources. Moreover, understanding these preferences enables producers and policymakers to align agricultural outputs with consumer needs, ensuring that market demand is met efficiently and sustainably.Gaining insights into stakeholder preferences is therefore essential for designing effective agricultural policies, promoting technology adoption, and developing marketing strategies (Custodio, Demont, and De Steur 2023; Sawassi et al. 2025).
Over the years, several preference elicitation and scaling techniques, such as Likert scales, rating, ranking, and pairwise comparison methods, have been widely employed in agricultural and consumer research. Likert and rating scales capture perceived importance or agreement, while ranking methods require respondents to order all items simultaneously, which can become cognitively demanding as the number of attributes increases. Pairwise comparisons simplify the task but still fail to reflect the relative importance among multiple competing attributes. As noted by Parvin (2016), these methods tend to be cognitively more demanding and are susceptible to response and scale-use biases, which can compromise the reliability and comparability of results across respondents.
Best-Worst Scaling (BWS) is a stated preference method, developed by Jordan J Louviere in 1987, that addresses these limitations by asking respondents to identify both the most and least important items within a choice set. Unlike traditional rating or ranking methods, which require evaluating all items simultaneously, BWS divides the task into smaller, more cognitively manageable parts, simplifying the process and helping respondents make more distinct trade-offs between attributes(Erdem, Rigby, and Wossink 2012). This approach captures the extremes in the inclinations of respondents and reduces the cognitive burden on respondents, making it easier for the surveyor to obtain more accurate and reliable responses with reduced biases (Kiritchenko and Mohammad 2017), (Burton et al. 2021).
Three main variants of BWS, Case 1 (Object case), Case 2 (Profile case), and Case 3 (Multi-profile case), facilitate identifying preferences according to the context and the nature of items or profiles to be evaluated. Case 1 is the simplest form of BWS, allowing respondents to choose the best and worst items in a list and make a relative ranking of the items Flynn and Marley (2014). Cases 2 and 3 deal with profiles which are combinations of levels of attributes. In the profile case, choices are made within the individual profiles, whereas in the multi-profile case, choices are made between whole profiles (J. J. Louviere, Flynn, and Marley 2015; Cheung et al. 2016).
While previous reviews have examined the methodological evolution and applications of BWS across disciplines (Schuster et al. 2024; Hollin et al. 2022; Beres et al. 2024), most have centred on health and policy domains. Comprehensive analyses focusing specifically on the agricultural sector remain limited. The present review aims to address this gap by systematically examining the use of BWS within agricultural research, highlighting methodological developments, thematic areas, and conceptual contributions. By integrating evidence and perspectives from existing studies, the review presents a coherent narrative on the expanding role of BWS in shaping preference-based research within agriculture.
2 Statistical foundations of BWS
The Random Utility Theory (RUT) underpins the fundamental principle of BWS Beres et al. (2024), which states that individuals make their choices based on the perceived utility characteristics or the characteristics of a product, which comprises observable attributes and some unobservable random component, as shown in Equation 1.
\[ U_{ij} = V_{ij} + \varepsilon_{ij} \tag{1}\]
where Uij is the total utility of the jth item for the ith consumer, Vij denote the utility from the observed characteristics, and εij is the random component. The stochastic component implies that while exact choices cannot be predicted, the probability of each alternative being selected can be estimated statistically Adikari and Diawara (2024).
In the context of BWS, this framework can be used to compare the ‘best’ and ‘worst’ choices of an individual.By requiring respondents to identify both extremes of preference within each choice set, BWS captures a fuller range of the utility distribution compared to traditional choice experiments. According to RUT, an item’s relative preference compared to others depends on how frequently it is chosen (J. Louviere et al. 2013). Recent methodological developments have further extended RUT to account for individual-level preference heterogeneity, allowing researchers to better understand differences in choices across respondents (Holmes, Adamowicz, and Carlsson 2017).
In agricultural research, RUT and BWS provide a framework for examining how different stakeholders evaluate competing options such as crop varieties, input combinations, market choices, or policy measures, based on perceived benefits and trade-offs. By linking observable attributes like yield, price, sustainability, and quality with individual preferences, BWS enables researchers to quantify the relative importance of these factors, offering valuable insights into agricultural decision-making.
3 Experimental Designs in BWS
The efficiency of a BWS study depends critically on the construction of choice sets in the questionnaire. Asking respondents to rank a large number of items can create cognitive strain and reduce data quality. Parvin (2016) noted out that it is challenging for the respondents to rank more than seven items in a single choice set. To address this, BWS organizes the items into smaller and manageable choice sets, typically containing three to six items each, allowing respondents to make meaningful comparisons without fatigue.
A statistically efficient design ensures that each item or attribute level appears an equal number of times across all choice sets, and that every possible pair of items co-occurs equally often with similar frequency Lee, Soutar, and Louviere (2008). This balance and orthogonality in the design facilitate the derivation of precise and reliable preference estimates.
Early BWS studies used 2J designs Flynn and Marley (2014) to generate choice sets, where J represents the number of items. However, as the number of items increases, the number of possible combinations grows exponentially, making such designs impractical for real-world surveys and burdensome for respondents. To overcome this challenge, recent studies employ Balanced Incomplete Block Design (BIBD) to generate combinations of items in each choice set, as it ensures the balanced occurrence and co-occurrence of objects. This approach is commonly used in the BWS object case (Case 1), where individual items are evaluated directly by respondents, allowing for manageable questionnaires without compromising statistical efficiency.
In profile and multi-profile cases, the focus shifts from single items to combinations of attributes that define a product or alternative. Here, the profiles are created using Orthogonal Arrays (OA). If there are K attributes, each with Lk (k = 1, 2, …, K) levels, an LK OA can be used to create profiles while maintaining orthogonality. Each profile is considered as a choice set in BWS case 2, while in Case 3 multiple profiles are combined into choice sets using BIBD. This approach allows researchers to estimate the relative importance of individual attributes and their levels, while keeping the task manageable for respondents (Aizaki and Fogarty 2019; Aizaki 2021).
4 Statistical Models for Analysis
Depending on the complexity of the data and objectives of the research, different analytical models are employed to extract insights from best–worst choices. These models range from simple counting approaches, which provide a basic understanding of preference patterns, to more sophisticated econometric models capable of capturing heterogeneity in preferences.
4.1 Counting approach
The counting method, which involves the frequencies of each item being selected as ‘best’ and ‘worst,’ is a simple yet effective approach used to analyse BWS data Burns et al. (2022). The Best-Worst (B-W) score is obtained by subtracting the number of times an item is marked as worst (Wᵢ) from the number of times it is marked as best (Bᵢ), which is then divided by the total number of respondents (n) and the frequency of an item appeared in each choice set (r) to get the standardised score (Equation 2;Equation 3) (Massey et al. 2015; Yin, Kamimura, and Imoto 2023). The Square root B-W score (Equation 4) and Standard B-W score (Equation 5) also represent the preferences Torok et al. (2023).
\[B\!-\!W\ Score = B_i - W_i \tag{2}\]
\[\text{Standard } B\!-\!W\ \text{score} = \frac{B_i - W_i}{r \times n} \tag{3}\]
\[\text{Sqrt. } B\!-\!W\ \text{score} = \sqrt{\frac{B_i}{W_i}} \tag{4}\]
\[\text{Standard Sqrt. } B\!-\!W\ \text{score} = \frac{\text{Sqrt. } B\!-\!W\ \text{score}}{\max(\text{Sqrt. } B\!-\!W\ \text{score})} \tag{5}\]
4.2 Modelling approaches
Statistical models grounded in econometric theory and probabilistic frameworks enable rigorous estimation of preference parameters. Modelling approaches provide greater analytical precision and account for response heterogeneity, compared to count-based methods. These models estimate the likelihood of an individual choosing a particular item as ‘best’ or ‘worst’. The probabilistic model represented in Equation 6 forms the theoretical foundation for the statistical models used in the analysis of BWS data. It considers a finite set of alternatives and estimates the probability of selecting an item as best, worst, or jointly as a best–worst pair based on underlying choice processes (A. A. Marley and Louviere 2005).
\[\mathrm{BW}_X(x, y) = \frac{B_X(x)\, W_X(y)} {\displaystyle \sum_{\substack{r,s \in X \\ r \ne s}} B_X(r)\, W_X(s)} \tag{6}\]
where BX(x) is the probability that the alternative x is chosen as best in X, WX(y) is the probability that the alternative y is chosen as worst in X, and BWX(x, y) is the joint probability of the alternative x is chosen as best in X and the alternative y ≠ x is chosen as worst in X.
Advanced models can capture preference heterogeneity across respondents that arises due to geographic, socioeconomic, or behavioural factors. This can be used in agricultural studies to identify the difference in choices of farmers and consumers based on farm size, access to resources, and individual-level factors.
4.2.1 Multinomial Logit Model (MNL)
MNL is based on the assumption that the preferences of individuals in a population are homogeneous. The joint probability of selecting an item as best and another as worst within a choice set is used to estimate the preference for that item (A. A. J. Marley, Flynn, and Australia 2015). Conceptually, the MNL model represents the probability of choosing a specific best–worst pair based on the relative utilities of the available items in a choice set. This probabilistic framework allows the model to capture the trade-offs respondents make when identifying their most and least preferred items. The resulting estimates provide a population-level measure of preference intensity of each item compared to a reference, making the MNL a fundamental model for advanced analyses of best–worst data (Cheung et al. 2019).
4.2.2 Latent Class Analysis (LCA)
LCA is a cluster analysis method used to uncover the unobserved heterogeneity among respondents when observable characteristics alone cannot form homogeneous groups. Based on this, respondents will be categorised into different latent classes sharing hidden attributes that can affect the selection. The optimal number of clusters is determined by statistical fit criteria such as Bayesian Information Criterion (BIC), Akaike Information Criterion (AIC), and McFadden’s Pseudo R-squared (ρ²), which are commonly used to assess model performance (Cheung et al. 2019; Barrowclough et al. 2023; Merlino et al. 2025).
4.2.3 Hierarchical Bayesian Model (HB)
HB models capture both within-respondent and across-respondent heterogeneity, producing individual-specific preference estimates (Lagerkvist, Okello, and Karanja 2012; Yeh, Hartmann, and Langen 2020). Lagerkvist, Okello, and Karanja (2012) demonstrated that the HB model outperforms the LCA by capturing both between- and within-respondent preference variation. Its ability to estimate individual-level parameters from limited data makes it particularly useful for analysing best–worst choices.
4.2.4 Random Parameter Logit (RPL) or Mixed Logit (MXL) Model
RPL model provides a more accurate depiction of real-world choice behaviour by allowing for random differences in individual preferences and accounting for correlations among unobserved factors (Viciunaite 2023). It is a generalisation of MNL, used to estimate the individual heterogeneity in preferences. Unlike the MNL, which assumes uniform preferences across respondents, the RPL allows parameters to vary randomly within the population, implying that different people have different preferences. The preference heterogeneity can be estimated by finding the standard deviation of each parameter’s distribution (Cheung et al. 2019).
4.2.5 Paired, Marginal, and Marginal Sequential Models for Profile Case
Three different choice modelling methods, paired, marginal, and marginal sequential models, are used to analyse the responses obtained from a BWS case 2 survey. All models assume that each attribute level provides some utility to the respondent, but differ in how the best and worst levels are determined. The utility of the level chosen as worst is considered the negative of the utility of the level selected as best.
The paired model identifies that the chosen best–worst pair represents the largest utility difference among all possible pairs in the set. The marginal model assumes that the best level has the maximum utility and the worst level the minimum utility among all levels, whereas in the marginal sequential model, the best level has the maximum utility among all levels and the worst level the minimum utility among the remaining levels.
In all three models, the estimated coefficients indicate the relative preference of respondents for each attribute level, providing insights into the trade-offs made when identifying the most and least important options (Aizaki and Fogarty 2019).
5 Bibliometric Insights into BWS in Agriculture
A bibliometric analysis was conducted using the bibliometrix package (Aria and Cuccurullo 2017) in R to examine studies employing BWS to elicit choices in agricultural contexts. The Dimensions database was selected for its broad coverage of multidisciplinary research (Hook, Porter, and Herzog 2018). Publications from 2011 to 2025 were retrieved using the search string: (“Best-Worst Scaling” OR “BWS”) AND (“agriculture” OR “farm” OR “food”). The search was limited to peer-reviewed journal articles and conference papers published in English, ensuring the inclusion of relevant and high-quality academic outputs. Although larger datasets can be obtained from other databases, the export restrictions in these platforms limit their use for the present analysis. The selection of Dimensions thus ensured consistency, transparency, and replicability of the bibliometric workflow.
After screening for relevance and removing duplicates, a total of 75 documents from 54 sources were retained for analysis. The chosen timespan captures both the emergence and evolution of BWS applications in agriculture, beginning with the earliest identifiable studies in 2011. The relatively small corpus reflects the recent adoption of BWS in this field and the method’s growing recognition as a robust alternative to traditional preference elicitation approaches. This also indicates a research gap and an opportunity for further exploration of BWS across diverse agricultural decision-making contexts.
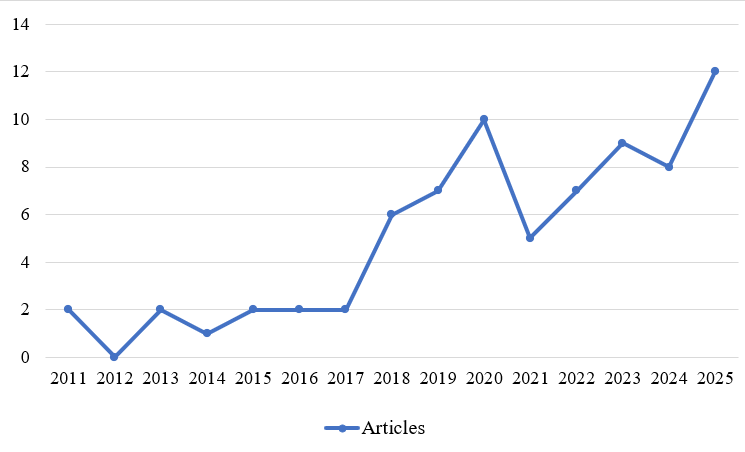
These records were analysed to interpret the research trends, current status, thematic distribution, advancements, and interrelationships among studies in this field. The analysis revealed an increasing trend in the scientific production, as shown in Figure 1, with an overall growth rate of 13.65% during the study period. The highest number of publications occurred in 2025, followed by 2020. From 2011 to 2017, the publication activity remained relatively stable and gained acceleration from 2018 onward, indicating a growing interest in BWS-based agricultural studies.
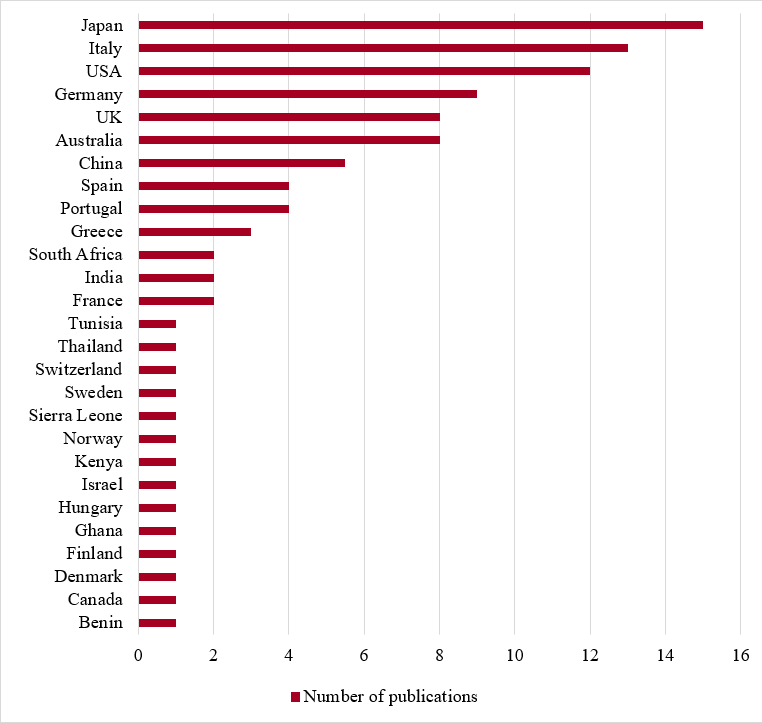
A total of 27 countries across the world have engaged in agricultural research employing BWS during this period. Japan (\(n\)=15) recorded the highest number of publications, followed by Italy (\(n\)=13) and the USA(\(n\)=12). Figure 2 illustrates the publication output of all the contributing countries, showing the trends in their research activity. The results indicate that while a few countries, particularly Japan, Italy, the USA, Germany, and the UK, dominate the field, several others are gradually adopting BWS in agricultural studies, reflecting its growing global relevance.
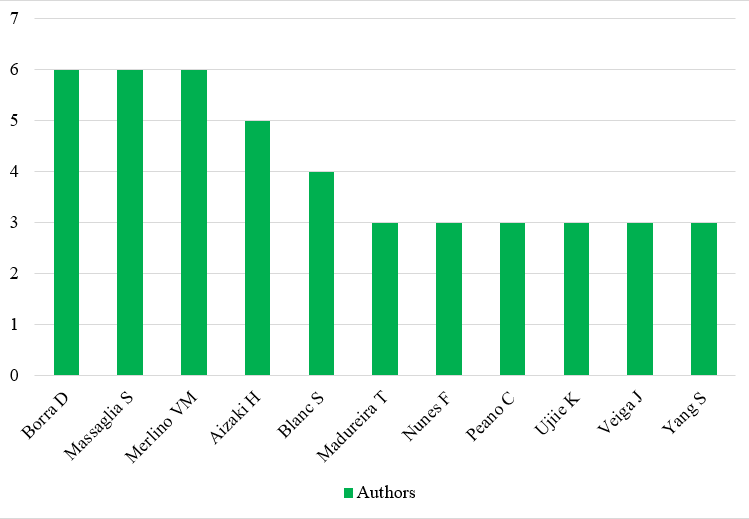
A total of 221 researchers contributed to the 75 examined articles, of which four were single-authored. The average number of authors per article is 3.63. Out of the total, 31 authors have published more than one article. Borra and Massaglia (\(n\)=6) are the authors with highest number of publications. Merlino (\(n\)=5), Aizaki (\(n\)=4), Blanc (\(n\)=3), Madureira (\(n\)=3), Nunes (\(n\)=3), Peano (\(n\)=3), Ujiie (\(n\)=3), Veiga (\(n\)=3), and Yang S (\(n\)=3) are the other relevant authors in this field, as given in Figure 3. An international co-authorship of 37.33% was identified, indicating the strong level of cross-country collaboration among the authors.
The reviewed studies were published in 54 journals. The most relevant journals among them were Foods (\(n\)= 6), Journal of Dairy Science (\(n\)=4), Agricultural Economics (\(n\)=3), Food Quality and Preference (\(n\)=3), Journal of Environmental Management (\(n\)=3), Sustainability (\(n\)=3), Agribusiness (\(n\)=2), Agriculture (\(n\)=2), Australian Journal of Agriculture (\(n\)=2), British Food Journal (\(n\)=2), and Land Use Policy (\(n\)=2).
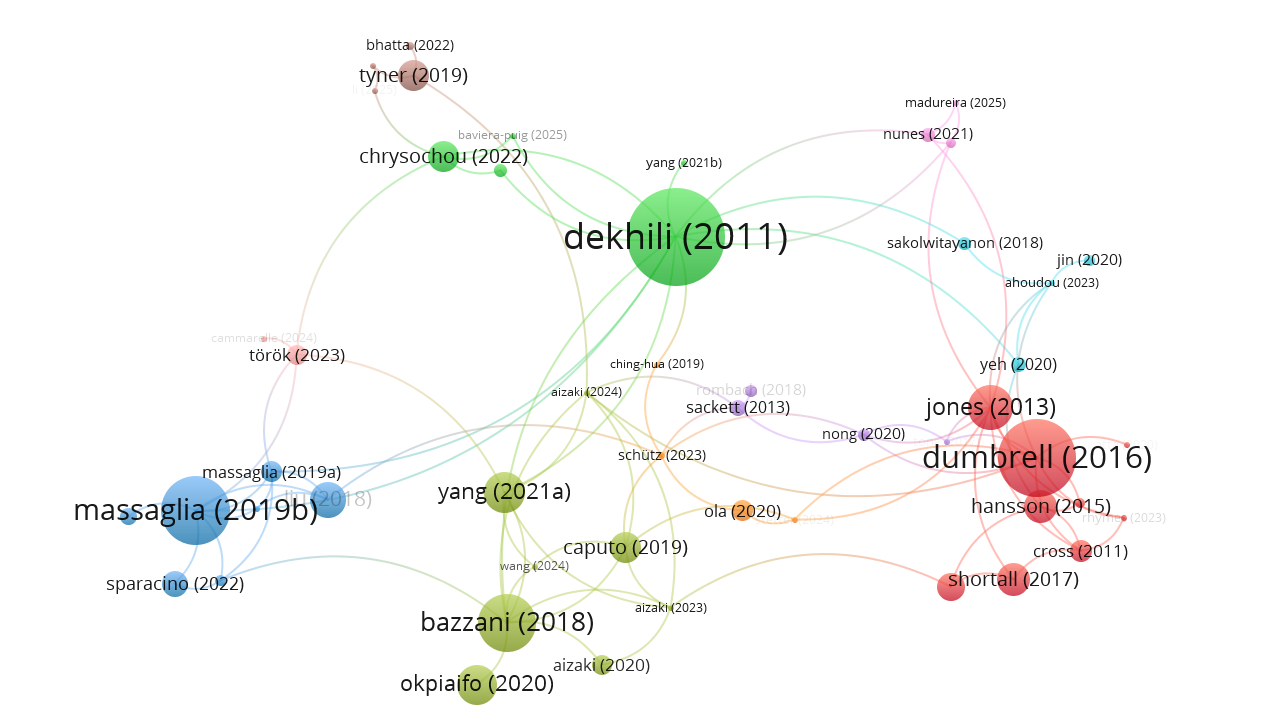
The citations of the articles were analysed and found that, on an average, each article had 19.8 citations, with an average of 3.11 citations per document per year. Eight studies had more than fifty citations, with (Dekhili, Sirieix, and Cohen 2011) recording the highest (140), followed by (Dumbrell, Kragt, and Gibson 2016) with 109 and (Massaglia et al. 2019) with 101. The citation network (Figure 4) revealed the interrelations among influential studies, highlighting the focal role of (Dekhili, Sirieix, and Cohen 2011) in connecting multiple research clusters within the field.
The bibliometric findings reveal a steady growth in the use of BWS within agricultural research over the past fifteen years. The method’s expanding adoption across countries and journals reflects its growing credibility as a reliable approach for capturing stakeholder preferences and supporting evidence-based decision-making. Although the number of retrieved publications is modest, this primarily reflects database-specific constraints and the relatively recent integration of BWS into agricultural research workflows. The observed trends highlight the increasing recognition of BWS as a valuable tool for understanding preferences in agricultural decision-making, signifying its potential for broader application in future agricultural studies.
6 Applications of BWS in Agricultural Research
The application of BWS in the agricultural sector has increased significantly over the years. The bibliometric analysis substantiates that there is a growing trend in its application from 2011 to 2025. The involvement of smaller choice sets and the ability to capture nuanced distinctions in preferences made BWS a more preferred method of choice evaluation over the traditional rating and ranking methods. This section examines the major studies that have employed BWS to understand the preferences of agricultural stakeholders.
The reviewed body of literature demonstrates that BWS has been applied across a broad spectrum of agricultural contexts, encompassing consumer behaviour, farm management, sustainability practices, policy evaluation, and genetic improvement. Table 1 presents an overview of the reviewed studies, summarising the types of BWS and the analytical methods used in different research contexts. It illustrates the wide range of agricultural and allied topics where BWS has been applied, with the three cases of BWS being applied to address distinct study objectives.
Among the reviewed literature, BWS Case 1 is the dominant one, featuring in the majority of publications. Research by (Baviera-Puig et al. 2025), (Uliano and Lerro 2025), (Wardyani et al. 2025), (Cammarelle et al. 2024), (Torok et al. 2023), (Aizaki and Takeshita 2023), (Giuggioli et al. 2023), (Chrysochou et al. 2022), (Sarma 2020), (Massaglia et al. 2019), (Bazzani et al. 2016), and (Dekhili, Sirieix, and Cohen 2011) used Case 1 to identify the preference patterns of consumers in the purchase of different agricultural products. It has also been employed to capture the choice behaviour of farmers regarding the selection of farm inputs as given in (Ahoudou et al. 2023), (Burns et al. 2022), (Maruyama et al. 2022), and (Aizaki et al. 2016). The studies by (Merlino et al. 2025), (Liu et al. 2025), (Zander et al. 2024), (Aizaki, Akahori, and Yamamoto 2025), (Chang et al. 2022), (Bhatta, Zander, and Garnett 2022), (Caputo and Lusk 2020), (Jackson et al. 2020), (Dumbrell, Kragt, and Gibson 2016), and (Cross, Rigby, and Edwards-Jones 2012) adopted BWS to analyse different agricultural technologies, practices, and policies. Additionally, (Ibe et al. 2024) and (Burns et al. 2022) applied BWS to support genetic breeding activities, while (Atta and Micheels 2020) identified the risks in agricultural production through an object case study.
BWS Cases 2 and 3 appeared in fewer studies which evaluated different attributes or profiles. These studies explored themes such as consumer choices (Aizaki and Sato 2020; Ola and Menapace 2020; Mizuki and Yasue 2025; Rolfe et al. 2023), production strategies (Sackett, Shupp, and Tonsor 2013; Chelang’a et al. 2025; Shittu et al. 2021), and agricultural policies (Guo and Shen 2020).
Across the reviewed studies, the analysis of the data is widely done through count-based methods as well as advanced modelling methods, including MNL, LCA, HB, and RPL, to capture different patterns of preference heterogeneity among respondents. Many of the researchers have applied LCA to identify the latent characteristics that can influence decision-making.
Collectively, these applications underscore the practical value of BWS in guiding agricultural innovation, marketing, and policymaking. By quantifying what stakeholders value most and least, BWS contributes to evidence-based strategies that align agricultural development with stakeholder priorities. Beyond identifying preferences, BWS has provided actionable insights that have informed marketing strategies, guided policy priorities, and shaped technology adoption frameworks. The studies applying BWS to consumer choice contexts have refined the design and marketing of agri-food products, while farmer-oriented studies have supported evidence-based input subsidy and risk management programs. Policy-oriented research has aided in prioritising sustainability measures and resource allocation in line with stakeholder values. Overall, the methodological rigour and interpretive strength of BWS have enabled a deeper understanding of stakeholder preferences and their translation into practically relevant interventions. The growing body of evidence positions BWS as a bridge between preference research and real-world agricultural policymaking.
| Subject area | Author | Research objective | Analysis method(s) |
|---|---|---|---|
| BWS Case 1 | |||
| Consumer choices | (Baviera-Puig et al. 2025) | Understanding the preferences for olive oil in the Iberian Peninsula and developing marketing strategies in the sector | Count analysis, LCA |
| (Uliano and Lerro 2025) | Preferences of Italian consumers and willingness to pay for antioxidant-rich pomegranates, based on the product attributes | Count analysis | |
| (Wardyani et al. 2025) | Preferences of farmer market consumers for agricultural products in Taiwan | Count analysis, RPL, LCA | |
| (Cammarelle et al. 2024) | Identification of attributes considered by consumers in the purchase of processed tomato products | Count analysis, cluster analysis | |
| (Torok et al. 2023) | Analysing international and country-specific preference patterns of fresh fruit and vegetable purchase by consumers in five selected European countries | Count analysis | |
| (Aizaki and Takeshita 2023) | Comparison of consumer preferences for sustainable dairy activities among the UK, the Netherlands, France, Italy, and Japan | Count analysis, conditional logit | |
| (Giuggioli et al. 2023) | Assessing choices during avocado purchase | Count analysis, HB, LCA | |
| (Rolfe et al. 2023) | Assessing the consumer support for avocados, environmental standard approaches, ecolabelling, and willingness to pay | Count analysis, RPL | |
| (Chrysochou et al. 2022) | Identifying the important attributes of olive oil consumers choose during purchase | Count analysis, LCA | |
| (Sarma 2020) | Identifying preferences of Bangladesh consumers regarding the food quality and safety attributes of fresh vegetables | Count analysis | |
| (Massaglia et al. 2019) | Examining the relative importance and the influence of demographic factors on consumer choices in fruits and vegetables | Count analysis, LCA | |
| (Bazzani et al. 2016) | Comparison of consumer preferences on food attributes in Europe and the US | MNL | |
| (Dekhili, Sirieix, and Cohen 2011) | Exploring the importance of origin attributes in olive oil purchase | Count analysis, LCA | |
| Farm management and input selection | (Ahoudou et al. 2023) | Assessment of farmers’ choices in selecting sweet potato varieties in Benin and the ranking of traits involved | Count analysis, LCA |
| (Maruyama et al. 2022) | Preference analysis for different agricultural inputs for rice production in the Senegal River Basin | Count analysis, cluster analysis | |
| (Aizaki et al. 2016) | Assessment of non-farmer community’s preference to assist with farm tasks | Count analysis | |
| Genetic improvement | (Burns et al. 2022) | Identifying important genetic traits of cattle among European dairy farmers | Count analysis, LCA |
| (Ibe et al. 2024) | Identification of Nigerian farmers’ preferences for plantain characteristics to aid variety development | Count analysis | |
| Agricultural technologies, practices, and policies | (Merlino et al. 2025) | Perceptions of Italian consumers regarding technological innovations for sustainable agriculture | HB, LCA |
| (Liu et al. 2025) | Consumer choices on adoption of sustainable environmental practices to reduce greenhouse gas emissions | RPL | |
| (Zander et al. 2024) | Adoption of agroecological practices by Kenyan farmers to formulate community-specific policies | Count analysis | |
| (Aizaki, Akahori, and Yamamoto 2025) | Measuring relative importance of agricultural and rural multifunctionality in Japan | Count analysis, cluster analysis | |
| (Chang et al. 2022) | Farmers’ preferences for adoption of green manure cover crops | Count analysis, LCA | |
| (Bhatta, Zander, and Garnett 2022) | Perceptions of people in western Nepal on governance of forest resource use | Count analysis | |
| (Caputo and Lusk 2020) | Consumer preferences on 13 agricultural and food policies in the US | RPL | |
| (Jackson et al. 2020) | Assessment of dairy farm management attributes | HB, LCA | |
| (Dumbrell, Kragt, and Gibson 2016) | Identification of carbon farming activities farmers prefer to adopt | Conditional logit | |
| (Cross, Rigby, and Edwards-Jones 2012) | Effectiveness of measures to reduce human exposure to E. coli O157 | Conditional logit | |
| Risk assessment | (Atta and Micheels 2020) | Ranking of important sources of risk in agricultural production among grain and oilseed farmers in Saskatchewan | MNL, LCA |
| BWS Case 2 | |||
| Consumer choices | (Aizaki and Sato 2020) | Impact of multidimensional country-of-origin attributes (growing, processing, company) on purchase of processed food in Japan | Paired model |
| (Ola and Menapace 2020) | Attitudes of Kenyan horticultural farmers toward market attributes for long-term engagement in high-value markets | Marginal sequential model | |
| Production strategies | (Sackett, Shupp, and Tonsor 2013) | Ranking sustainable farming production attributes and identifying heterogeneity across demographic classes | Count analysis, Paired model, Marginal model, LCA |
| BWS Case 3 | |||
| Production strategies | (Chelang’a et al. 2025) | Developing climate-smart dairy strategies in Central Kenya based on farmer preferences | Count analysis, LCA |
| (Shittu et al. 2021) | Examination of Nigerian smallholder farmers shifting to climate-smart agriculture | RPL | |
| Consumer choices | (Mizuki and Yasue 2025) | Consumer behaviour on low-amylose rice using two-stage BWS and sensory evaluation | MNL |
| Agricultural policies | (Guo and Shen 2020) | Perceptions of rural Chinese residents on agri-environmental policies | MNL, RPL, LCA |
7 Conclusion
The application of BWS in agricultural research has been increasing rapidly in recent years, as confirmed by the bibliometric analysis, with the object case (Case 1) emerging as the most commonly employed. BWS proves to be a significant tool in the field of agriculture for understanding farmer preferences and consumer choices. By capturing the most and least preferred items, it enables the relative ranking of attributes. This knowledge helps the researchers to prioritise the traits for product development and trend prediction, enabling policymakers to use the interpretations obtained from BWS to frame policies.
The review underscores that the three cases of BWS facilitate more precise measurement of preferences in different contexts of agricultural studies, such as environmental sustainability, productivity, and cost-related trade-offs. By providing a robust statistical foundation, BWS supports more informed policy formulation and management decisions. It effectively addresses the limitations of traditional preference measurement techniques and offers a comprehensive understanding of stakeholder choices through the adoption of advanced modelling approaches. Consequently, BWS enables more targeted and effective interventions in the field of agriculture.
Careful experimental design, precise statistical analysis, and thoughtful interpretation of results will open up new avenues for applying BWS in agricultural research. Future research should focus on developing more efficient experimental designs that better capture heterogeneity in responses. As noted by (Gopinath et al. 2021), developing robust, open-source web applications with intuitive, interactive interfaces can make agricultural data analysis more accessible for researchers. Such platforms and software tools can promote wider adoption of BWS in the agricultural sector, from on-farm management to policy making.
References
Publication Information
- Submitted: 24 October 2025
- Accepted: 14 November 2025
- Published (Online): 15 November 2025
Reviewer Information
Reviewer 1:
AnonymousReviewer 2:
Anonymous
The statements, opinions and data contained in all publications are solely those of the individual author(s) and contributor(s) and not of the publisher and/or the editor(s).
The publisher and/or the editor(s) disclaim responsibility for any injury to people or property resulting from any ideas, methods, instructions or products referred to in the content.
© Copyright (2025): Author(s). The licensee is the journal publisher. This is an Open Access article distributed under the terms of the Creative Commons Attribution-NonCommercial-NoDerivatives 4.0 International License, which permits non-commercial use, sharing, and reproduction in any medium, provided the original work is properly cited and no modifications or adaptations are made.