
Digital Eyes on Nature - Geospatial Technologies in Biodiversity Monitoring and Conservation
Geospatial technologies are revolutionizing biodiversity monitoring by enabling spatially explicit, repeatable, and near real-time observations of species, habitats, and ecosystem processes. Read more …

Geospatial technologies are revolutionizing biodiversity monitoring by enabling spatially explicit, repeatable, and near real-time observations of species, habitats, and ecosystem processes. Advances in Earth observation, drone-based remote sensing, environmental DNA (eDNA) georeferencing, artificial intelligence, and cloud computing have enhanced the ability to detect environmental changes, analyze ecological patterns, and assess conservation outcomes. These tools offer detailed insights into land-cover dynamics, vegetation structure, species distribution, and ecological connectivity, supporting evidence-based management across scales. Integrating diverse datasets such as optical, radar, LiDAR, hyperspectral imagery, UAV data, in situ sensors and molecular records improves ecological understanding and conservation planning. However, challenges such as data bias, validation requirements, ethical concerns, and unequal global access remain. This study reviews technological advances, applications, limitations, and future directions in geospatial biodiversity monitoring, emphasizing the importance of combining digital tools with inclusive governance and ecological knowledge for effective and equitable biodiversity conservation.
AI, GIS, CNN, LiDAR, Remote sensing, Geospatial technology
1 Introduction
Anthropogenic pressures such as changes in land use and cover, habitat degradation and fragmentation, biological invasions, climate change, and the unsustainable use of natural resources are the main causes of the rapid and widespread reduction in global biodiversity. These factors work in concert at both temporal and spatial dimensions, upsetting the structure and function of ecosystems and hastening the extinction of species (Pettorelli et al. 2014; Díaz et al. 2019). Although conventional biodiversity surveys based on field observations and taxonomic inventories provide high-quality ecological information, they are often constrained by substantial labour requirements, limited spatial coverage and infrequent sampling intervals. As a result, such approaches struggle to capture dynamic ecosystem processes or to provide consistent long-term monitoring across large geographic extents.
As a result of these constraints, geospatial technologies are being used more and more in conservation science as essential instruments for monitoring and assessing biodiversity. Standardized and repeatable measures of land cover, vegetation productivity, habitat structure, and environmental change at regional to global scales are made possible by satellite remote sensing platforms, particularly long-term Earth observation projects. These data streams make it possible to identify habitat fragmentation, degradation, and loss at temporal frequencies that are not possible with field-based surveys alone (Turner et al. 2015; Pettorelli et al. 2014). Geographic Information Systems (GIS) that use remotely sensed data facilitate spatially explicit analysis, including modeling species distribution, evaluating connectivity, and identifying regions of conservation priority.
The ecological information richness of geospatial data has been significantly increased by recent technological developments. Detailed insights into canopy structure, vegetation composition, and habitat heterogeneity-important factors influencing biodiversity patterns-are now possible thanks to high-resolution optical imagery, aerial and terrestrial LiDAR, hyperspectral sensors, and drone-based mapping systems (Asner and Martin 2008). Simultaneously, large-scale, repeatable analyses of multi-temporal remote sensing datasets have been made possible by the growing availability of cloud-based platforms like Google Earth Engine. This has made it possible to monitor ecosystems almost continuously and quickly assess environmental change (Gorelick et al. 2017).
By making it possible to automatically extract ecological information from sizable and complicated databases, developments in artificial intelligence and machine learning have further revolutionized biodiversity monitoring. Deep learning techniques are now widely used to automatically identify organisms from camera-trap images and acoustic recordings, model species distributions, and classify land-cover types. These techniques greatly reduce manual processing effort while increasing detection accuracy (Willi et al. 2019; Christin, Hervet, and Lecomte 2019). These techniques are especially useful for scaling biodiversity surveys over large regions and for detecting uncommon, cryptic, or elusive species.
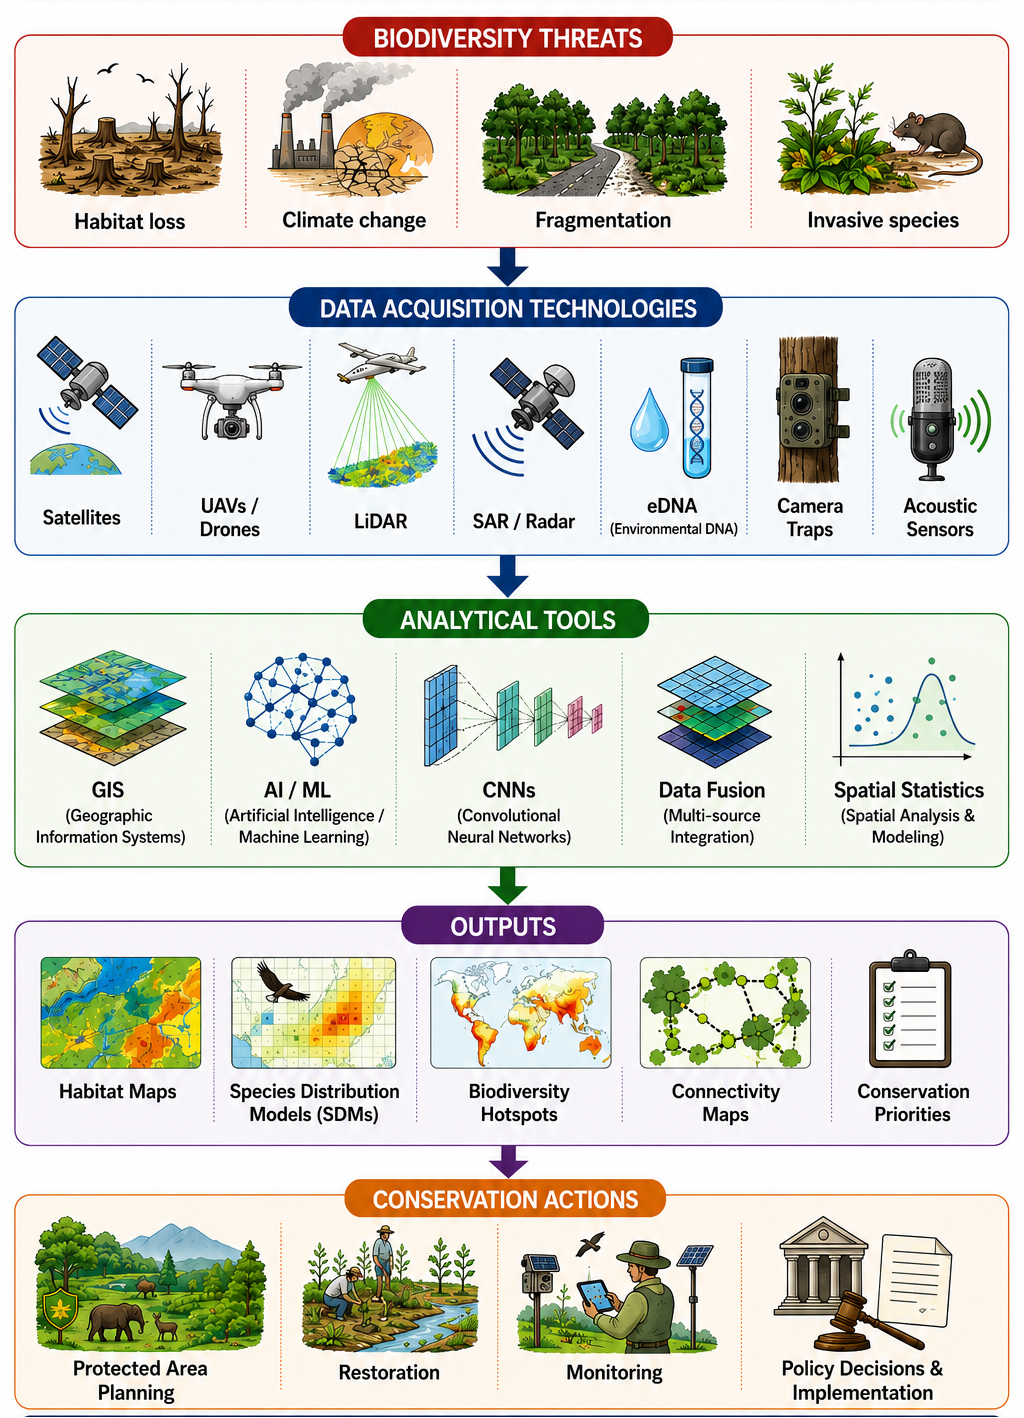
The integration of geospatial data with molecular tools, particularly environmental DNA (eDNA), marks a major advance in biodiversity assessment. Georeferenced eDNA enables detection of nocturnal, cryptic, and low-abundance species, complementing remote sensing and field surveys. When combined with spatial modelling, it improves the accuracy of biodiversity mapping and understanding of species distributions (Deiner et al. 2017; Ruppert, Kline, and Rahman 2019). Together, these advances are driving a shift from site-based surveys to integrated, data-rich, and continuously updated monitoring systems. This digital transformation supports evidence-based conservation planning, adaptive management, and timely policy responses in a rapidly changing environment. Figure 1 illustrates the conceptual framework of geospatial biodiversity monitoring, highlighting the integration of multiple data acquisition technologies, analytical tools, and conservation applications for evidence-based biodiversity assessment and management.
2 Evolution of geospatial tools for biodiversity science
Over the past few decades, there has been a significant evolution in the use of geospatial technologies in biodiversity science. The classification of land cover using coarse spatial resolution imagery was the main focus of early ecological remote sensing research. This method produced generic representations of ecosystems but gave little understanding of biological processes or species-habitat interactions. Despite these limitations, these early methods established the groundwork for landscape-scale ecological research and spatially explicit biodiversity evaluations (Pettorelli et al. 2014).
The creation of long-term Earth observation projects, most notably the Landsat mission, marked a significant turning point in geographic biodiversity monitoring. Landsat has made it possible to conduct retrospective assessments of changes in land use and land cover, habitat loss and fragmentation, and long-term ecosystem dynamics at regional to global scales thanks to a continuous archive that dates back to the early 1970s (Wulder et al. 2019). For determining biodiversity trends and evaluating the cumulative effects of anthropogenic pressures over time, the availability of reliable, publicly available historical data has proven especially beneficial.
The ability to monitor biodiversity has been greatly improved by more recent satellite missions, such as the Copernicus Sentinel constellation, which offer improved spectral features, higher geographical resolution, and significantly higher temporal revisit frequency. Sentinel-2 multispectral imagery provides detailed observations of vegetation condition, phenology, and habitat heterogeneity at revisit intervals of only a few days, while Sentinel-1 synthetic aperture radar allows all-weather monitoring of vegetation structure and land surface change (Drusch et al. 2012). When combined, these missions overcome many of the time constraints of previous satellite systems to enable nearly continuous tracking of ecosystem changes. In parallel, the emergence of commercial satellite platforms providing sub-meter spatial resolution has facilitated fine-scale habitat mapping and, in some cases, direct or indirect detection of organisms and ecological features.
Airborne remote sensing has grown rapidly due to advancements in sensor miniaturization, especially with regard to the use of unmanned aerial vehicles (UAVs or drones). The mapping of microhabitats, the detection of fine-scale structural variation, and the monitoring of individual trees, nests, or other biologically significant structures are all made possible by drone-based platforms’ ability to obtain ultra-high-resolution imagery at centimeter-scale detail. Drones are particularly useful for focused conservation applications and local-scale biodiversity evaluations because of these characteristics (Anderson and Gaston 2013).
Complementing optical imaging technologies, airborne and terrestrial Light Detection and Ranging (LiDAR) systems have transformed the study of biodiversity-habitat relationships by providing detailed three-dimensional representations of vegetation structure. LiDAR-derived metrics such as canopy height, vertical complexity and understory structure are strongly linked to species richness and community composition across a wide range of ecosystems, making LiDAR a critical tool for habitat quality assessment and biodiversity modelling (Asner and Martin 2008). Advances in cloud computing, machine learning, and artificial intelligence have strengthened geospatial capabilities. Cloud platforms enable rapid processing of large, multi-sensor and multi-temporal datasets, while AI techniques automate extraction of ecological information. Together, these innovations enhance ecosystem monitoring and support more integrative, scalable, and data-driven conservation approaches (Christin, Hervet, and Lecomte 2019; Gorelick et al. 2017).
3 Major geospatial technologies for biodiversity monitoring
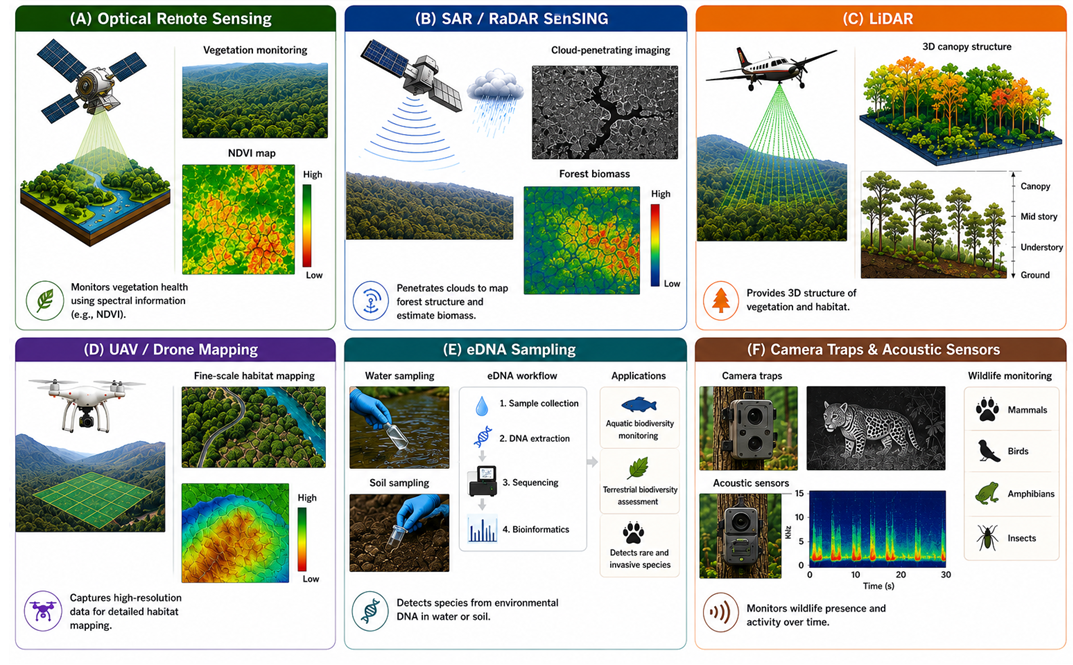
Geospatial technologies play a critical role in contemporary biodiversity monitoring by supporting continuous, large-scale evaluation of ecosystems and species distributions. Recent developments in remote sensing, molecular tools, environmental sensors, and spatial analytical methods have significantly improved the ability to assess habitat quality, vegetation patterns, wildlife occurrence, and ecological changes with greater accuracy and efficiency compared to conventional field surveys. Figure 2 presents the major geospatial technologies applied in biodiversity monitoring, including optical remote sensing, SAR/radar sensing, LiDAR, UAV/drone-based mapping, eDNA analysis, and camera trap–acoustic sensor systems. The figure demonstrates how these technologies contribute to vegetation assessment, biomass estimation, three-dimensional habitat analysis, high-resolution landscape mapping, species identification, and wildlife monitoring across different ecosystems.
3.1 Optical remote sensing
Optical remote sensing is among the most commonly applied geospatial techniques for monitoring biodiversity and ecosystem dynamics. These systems record reflected solar energy in the visible, near-infrared (NIR), and shortwave infrared (SWIR) regions of the electromagnetic spectrum, making it possible to evaluate vegetation health, productivity, and seasonal behaviour. Various spectral indices generated from optical data, such as the Normalized Difference Vegetation Index (NDVI), Enhanced Vegetation Index (EVI), Soil-Adjusted Vegetation Index (SAVI), and Photochemical Reflectance Index (PRI), are widely used as indicators of photosynthetic efficiency, biomass accumulation, vegetation stress, and phenological variation (Pettorelli et al. 2014; Huete et al. 2002). These indicators play an important role in assessing habitat quality, ecosystem processes, vegetation condition, and biodiversity patterns in forests, wetlands, grasslands, and agricultural ecosystems. Long-term satellite missions, particularly NASA’s Landsat series and the European Space Agency’s Sentinel-2 program, have significantly strengthened biodiversity monitoring efforts through the provision of freely available and continuous multi-temporal datasets. These extensive archives support the monitoring of deforestation, habitat fragmentation, vegetation decline, invasive species expansion, and ecological restoration over broad spatial and temporal scales (Wulder et al. 2019; Drusch et al. 2012). Frequent satellite revisit cycles also enable near-real-time observation of environmental disturbances, including droughts, wildfires, floods, and land-use transformations.
Optical remote sensing plays a crucial role in studying vegetation phenology, as seasonal changes in vegetation are closely linked to ecosystem processes and species interactions. Time-series satellite data enable continuous monitoring of key phenological events such as leaf emergence, flowering, senescence, and variations in canopy greenness throughout the year. These observations are valuable for assessing the impacts of climate change on ecosystem dynamics, species distribution shifts, and habitat suitability patterns (Pettorelli et al. 2014). Moreover, multi-seasonal imagery improves the differentiation of vegetation types and habitat classes, thereby strengthening biodiversity evaluation and conservation planning. Recent advances in hyperspectral remote sensing have significantly enhanced vegetation analysis compared to conventional multispectral systems. By capturing hundreds of narrow, continuous spectral bands, hyperspectral sensors provide detailed information on plant biochemical and physiological characteristics, including chlorophyll concentration, water content, nutrient status, lignin–cellulose composition, and stress-related pigments. This rich spectral information facilitates improved discrimination of plant functional types and, in certain cases, enables species-level identification (Rocchini et al. 2016). As a result, hyperspectral data are increasingly utilized in applications such as species diversity mapping, invasive species detection, forest health monitoring, and ecosystem stress assessment.
The development of very high-resolution satellite platforms and unmanned aerial vehicle (UAV)-based optical sensors has further broadened the scope of ecological applications. High spatial resolution imagery allows detailed characterization of fine-scale landscape features such as canopy gaps, microhabitats, riparian zones, and coral reef structures that are often not detectable using coarser datasets. In addition, the integration of optical remote sensing with machine learning and artificial intelligence techniques has substantially improved automated land-cover classification, habitat suitability modelling, biodiversity hotspot detection, and species distribution mapping, offering higher accuracy and operational efficiency (Zhu et al. 2017; Maxwell, Warner, and Fang 2018).Despite these advantages, optical remote sensing is subject to several limitations. Atmospheric interference, cloud cover, terrain-induced shadows, and spectral saturation in dense vegetation can reduce data quality, particularly in tropical and humid regions. Furthermore, many biodiversity applications rely on indirect habitat proxies rather than direct species observations, which may not fully capture actual species richness or abundance patterns (Rocchini et al. 2016). Consequently, there is a growing consensus that integrating optical remote sensing with complementary methods such as field surveys, LiDAR, radar observations, UAV data, and environmental DNA (eDNA) approaches is essential for generating more robust and comprehensive biodiversity assessments.
3.2 Radar and microwave sensing
Radar and microwave remote sensing have become essential tools in biodiversity assessment and ecosystem monitoring due to their capability to collect information under almost all environmental and lighting conditions. Unlike optical sensors that rely on reflected sunlight, radar systems actively transmit microwave signals and record the reflected energy from the Earth’s surface. Because of this active sensing mechanism, radar observations can be obtained during both daytime and nighttime and are minimally affected by cloud cover, fog, smoke, or rainfall. These characteristics make radar-based remote sensing especially valuable in tropical and humid regions where continuous cloud cover often restricts the use of optical imagery. Among microwave technologies, Synthetic Aperture Radar (SAR) is one of the most widely applied systems for ecological and environmental studies. SAR sensors are highly responsive to vegetation structure, canopy texture, moisture levels, and surface roughness, enabling accurate assessment of forest cover, biomass distribution, wetland extent, floodplain dynamics, and habitat fragmentation (Le Toan et al. 2011). Since microwave signals can partially penetrate vegetation canopies, SAR data provide useful information about forest structural complexity, which is closely linked with habitat quality and biodiversity patterns.
The launch of modern satellite missions, particularly the European Space Agency’s Sentinel-1 constellation, has greatly expanded the application of radar remote sensing in ecological research. Sentinel-1 delivers freely accessible, high-frequency C-band SAR observations that support continuous monitoring of forests, wetlands, agricultural landscapes, and coastal ecosystems worldwide (Torres et al. 2012). Its short revisit interval enables rapid detection of environmental changes such as deforestation, habitat degradation, wildfires, floods, and land-use transitions. This capability is particularly important for biodiversity conservation and environmental monitoring in remote and difficult-to-access regions.
Radar remote sensing is widely used for estimating forest biomass and carbon stocks, which serve as key indicators of ecosystem productivity and climate regulation. Variations in Synthetic Aperture Radar (SAR) backscatter, along with interferometric radar approaches, provide valuable insights into canopy height, vegetation density, and forest structural attributes. These measurements enhance the detection of carbon-rich ecosystems and biodiversity-rich regions. In particular, long-wavelength SAR systems such as L-band and P-band offer improved penetration through dense vegetation canopies, making them especially effective for monitoring tropical forests and identifying areas of ecosystem degradation (Saatchi et al. 2011).The integration of radar data with optical remote sensing has significantly advanced habitat characterization and biodiversity assessment. While optical sensors capture spectral information related to vegetation composition and productivity, radar contributes complementary structural and moisture-related information. The fusion of these datasets helps mitigate limitations such as cloud cover, seasonal variability, and sensor-specific constraints, resulting in more reliable land-cover classification, habitat mapping, and ecosystem modelling across diverse environmental settings (Rocchini et al. 2016). Consequently, multi-sensor approaches are increasingly applied in studies focusing on forest fragmentation, wetland dynamics, wildlife habitat evaluation, and ecosystem restoration.
Advancements in radar technology, cloud-based geospatial processing, and artificial intelligence have further expanded the ecological applications of SAR data.Machine learning and deep learning techniques are increasingly employed to process large-scale radar datasets for automated forest change detection, habitat classification, and ecological monitoring with improved accuracy and efficiency (C. Zhang et al. 2018). In addition, the integration of SAR with LiDAR data, UAV-based imagery, and field observations has strengthened multi-scale analyses of habitat structure and biodiversity distribution.Despite these advantages, radar remote sensing has inherent limitations. SAR backscatter is influenced by multiple interacting factors such as vegetation structure, soil and canopy moisture, terrain conditions, and sensor wavelength, making interpretation complex. The presence of speckle noise and geometric distortions can further affect data quality and complicate analysis. Moreover, radar data processing often requires advanced computational resources and technical expertise. Therefore, the combined use of radar with optical imagery, ground-based surveys, and ecological modelling approaches is increasingly recommended to obtain more accurate and comprehensive biodiversity assessments.
3.3 LiDAR (Light Detection and Ranging)
Light Detection and Ranging (LiDAR) has become an important remote sensing technology for ecological studies and biodiversity assessment because of its capability to generate accurate three-dimensional information about vegetation and terrain structure. LiDAR systems function by transmitting laser pulses toward the Earth’s surface and calculating the time required for the reflected signals to return to the sensor. Using these measurements, highly detailed models of land elevation, forest canopy structure, and vegetation architecture can be produced. In contrast to passive optical sensors that mainly record reflected light, LiDAR directly captures vertical structural properties of ecosystems, making it highly effective for analysing habitat complexity and species–environment interactions (Dubayah et al. 2020; Guo et al. 2020).Several structural characteristics derived from LiDAR data, including canopy height, vertical layering, crown arrangement, gap fraction, foliage density, and understorey structure, are strongly linked to habitat heterogeneity, which plays a major role in shaping biodiversity distribution. Many organisms rely on distinct vertical habitat zones for feeding, nesting, movement, and protection; therefore, LiDAR-derived structural information provides valuable insights into habitat suitability and ecological niche availability in forested and heterogeneous landscapes. This technology is particularly useful in dense forests where traditional optical imagery often fails to capture detailed beneath-canopy structural variations (Ehbrecht et al. 2017).
Airborne LiDAR has been extensively utilized for characterizing forest structure, estimating aboveground biomass, quantifying carbon storage, and assessing habitat quality. A wide range of ecological studies has demonstrated strong relationships between LiDAR-derived measures of structural complexity and species diversity, particularly among forest-dependent taxa such as birds, mammals, insects, and arboreal organisms (Davies and Asner 2014). Forest ecosystems exhibiting higher vertical stratification and canopy complexity tend to support greater biodiversity, as they provide diverse ecological niches and microhabitats. In addition, LiDAR-based structural indicators have enhanced understanding of forest dynamics, vegetation regeneration, and ecosystem processes across environmental gradients (Coops et al. 2021).
Recent advancements in terrestrial LiDAR, UAV-mounted laser scanning systems, and spaceborne LiDAR missions have significantly expanded the application of this technology in ecological research. Satellite missions such as NASA’s Global Ecosystem Dynamics Investigation (GEDI) and ICESat-2 deliver large-scale observations of forest structure, biomass distribution, and ecosystem dynamics, enabling analyses at regional to global scales (Dubayah et al. 2020). These datasets are increasingly applied in monitoring forest degradation, habitat fragmentation, and ecological responses to climate change. At finer scales, drone-based LiDAR systems provide high-resolution structural information with greater operational flexibility, enhancing local ecosystem assessments (Seidaliyeva et al. 2025).The integration of LiDAR with complementary geospatial technologies, including optical and hyperspectral remote sensing, Synthetic Aperture Radar (SAR), and Geographic Information Systems (GIS), has substantially improved biodiversity assessment and habitat modelling. While optical and hyperspectral data provide insights into vegetation composition and physiological status, LiDAR contributes precise three-dimensional structural information. The fusion of these datasets enables more robust habitat classification, ecosystem characterization, and species distribution modelling across varied environmental conditions (Rocchini et al. 2016).
The application of artificial intelligence and machine learning techniques has further advanced the ecological use of LiDAR data. Modern algorithms are capable of efficiently processing large-scale three-dimensional point cloud datasets to classify vegetation types, estimate biomass, identify habitat features, and model biodiversity patterns with high accuracy (Lopatin et al. 2016). Deep learning frameworks and cloud-based geospatial platforms are increasingly facilitating automated ecosystem mapping, habitat monitoring, and conservation planning using LiDAR-derived products (Guo et al. 2020).Despite its strengths, LiDAR technology is associated with certain limitations. Airborne LiDAR surveys are often costly and require specialized equipment as well as technical expertise for both data acquisition and processing. The substantial volume of generated data also demands high computational resources and advanced analytical capabilities. Moreover, factors such as dense canopy cover, complex terrain, and sensor configuration can influence data accuracy and interpretation. Nevertheless, due to its ability to capture detailed vertical structural information, LiDAR remains one of the most powerful tools for biodiversity monitoring and ecological analysis.
3.4 Unmanned Aerial Vehicles (UAVs)
Unmanned Aerial Vehicles (UAVs), commonly known as drones, have become important tools in biodiversity monitoring and ecological research because they provide ultra-high-resolution imagery with high spatial and temporal flexibility. Unlike conventional satellite systems, UAVs operate at low altitudes and can capture detailed ecological information that is often difficult to detect using coarse-resolution satellite imagery. Their rapid deployment and flexible flight operations make them highly suitable for repeated monitoring of ecosystems and environmental changes over short time intervals (Anderson and Gaston 2013). UAV-based remote sensing is widely used in biodiversity assessment, habitat mapping, wildlife monitoring, and ecosystem management. Drones are frequently applied to map canopy gaps, monitor forest regeneration, assess wetlands and coral reefs, and validate satellite-derived environmental data. In wildlife studies, UAVs are useful for detecting and counting birds, mammals, marine organisms, nests, and burrows while causing minimal disturbance to natural habitats (Christie et al. 2016). Their ability to access remote and difficult terrain has further increased their importance in ecological surveys and conservation programs. Recent improvements in UAV sensor technologies have significantly expanded their applications in biodiversity research. Modern drones can carry different types of sensors, including RGB cameras, multispectral sensors, hyperspectral imagers, thermal cameras, and LiDAR systems. These sensors provide detailed information on vegetation condition, species composition, habitat structure, and moisture status. Thermal imaging technology is increasingly used for detecting wildlife populations, monitoring nocturnal animals, and identifying organisms hidden beneath dense vegetation (Barnas et al. 2018).
The integration of unmanned aerial vehicles (UAVs) with artificial intelligence, machine learning, and computer vision has significantly enhanced the efficiency and precision of ecological monitoring. Automated image analysis systems are now capable of detecting, classifying, and enumerating wildlife from high-resolution drone imagery and video datasets, thereby substantially reducing manual processing efforts (Willi et al. 2019). In parallel, deep learning frameworks are increasingly being applied for habitat mapping, invasive species detection, species identification, and the analysis of ecosystem change dynamics. These developments have strengthened the application of UAVs in rapid biodiversity assessments, conservation planning, and long-term ecological monitoring. UAVs also play an important role in ecosystem restoration and environmental management. High-resolution aerial imagery acquired from drones is widely used to assess habitat degradation, track reforestation and afforestation initiatives, monitor coastal erosion processes, and detect environmental disturbances such as wildfires, floods, and unauthorized land-use changes. Within agricultural landscapes, UAVs support precision agriculture and agroecological research by enabling monitoring of crop health, pollinator dynamics, and biodiversity patterns within farmlands (Tang and Shao 2015).
Technological enhancements in autonomous flight control, power efficiency, cloud computing, and real-time analytics have increased the ecological relevance of UAV platforms, and their coupling with satellite datasets, GIS, LiDAR, and ground-based measurements has strengthened biodiversity assessment and habitat modelling frameworks (Manfreda et al. 2018).Such integrative approaches provide a more holistic understanding of ecological processes and species–environment interactions.Despite these advantages, UAV-based biodiversity monitoring is associated with certain limitations. Operational constraints include sensitivity to weather conditions, limited flight endurance due to battery capacity, regulatory restrictions, and relatively restricted spatial coverage compared to satellite-based systems. Moreover, the processing and interpretation of high-resolution UAV data require considerable computational resources and technical expertise. In addition, UAV operations may cause disturbance to wildlife in ecologically sensitive areas due to noise and proximity effects. Nevertheless, owing to their high spatial resolution, flexibility, and declining operational costs, UAVs are increasingly recognized as a highly valuable tool for contemporary biodiversity monitoring and conservation applications.
3.5 Environmental DNA (eDNA) and molecular geospatial data
Environmental DNA (eDNA) has become an important and innovative tool for biodiversity assessment and ecological monitoring. eDNA consists of genetic material released by organisms into the environment through sources such as skin cells, mucus, feces, urine, saliva, pollen, spores, and decaying tissues. These traces of DNA can be collected from environmental samples including water, soil, sediment, snow, and even air, enabling scientists to identify species without directly observing or capturing them (Deiner et al. 2017). Due to its non-invasive and highly sensitive nature, eDNA techniques are particularly effective for detecting rare, endangered, invasive, or difficult-to-observe species that may not be easily identified through conventional survey methods. A major advantage of eDNA-based monitoring is its ability to evaluate biodiversity rapidly across extensive geographic regions while causing minimal disturbance to natural ecosystems. In aquatic environments, eDNA has been widely used to monitor fish, amphibians, molluscs, plankton, and marine organisms. Terrestrial applications are also expanding and now include the study of soil microorganisms, insects, mammals, birds, and airborne biological particles such as pollen and fungal spores (Taberlet et al. 2018). The development of high-throughput sequencing and metabarcoding technologies has further improved eDNA analysis by enabling simultaneous identification of multiple species from a single environmental sample, thereby increasing the efficiency of biodiversity surveys.
When environmental DNA samples are linked with geographic coordinates and incorporated into Geographic Information Systems (GIS), they generate spatially detailed biodiversity information that complements traditional ecological field observations and remote sensing data. The combination of eDNA with remotely sensed environmental variables has substantially enhanced species distribution modelling, habitat suitability analysis, and landscape level biodiversity assessment. Environmental characteristics derived from remote sensing platforms such as vegetation cover, canopy structure, land use patterns, temperature, moisture conditions, and hydrological features can be integrated with molecular species detections to better understand ecological relationships and species environment interactions (Ruppert, Kline, and Rahman 2019). This combined approach improves the accuracy of biodiversity mapping and ecological prediction across diverse landscapes.
Ongoing advancements in satellite remote sensing, hyperspectral imaging, LiDAR, and UAV-based observations have enhanced the role of eDNA in ecology by integrating large-scale environmental monitoring with detailed species detection, supporting conservation planning, invasive species monitoring, and ecosystem analysis (Bush et al. 2019). For instance, integrating eDNA results with remotely sensed temperature and hydrological data has improved the monitoring of freshwater ecosystems and the identification of environmentally sensitive habitats.The growing use of artificial intelligence (AI), machine learning, and advanced bioinformatics has also improved the processing and interpretation of complex genomic and environmental datasets. These computational tools help enhance species identification, biodiversity hotspot mapping, ecological forecasting, and environmental monitoring. As a result, integrated eDNA and remote sensing approaches are increasingly being applied in ecosystem restoration projects, protected area management, and early-warning systems for invasive or threatened species (Cordier et al. 2021).
Despite its considerable potential, eDNA monitoring still faces several scientific and technical limitations. Environmental factors such as temperature, ultraviolet radiation, pH, salinity, and microbial activity can influence DNA degradation and affect detection reliability. In addition, contamination risks, incomplete reference databases, and uncertainties related to estimating species abundance remain major challenges (Deiner et al. 2017). Moreover, eDNA methods generally provide limited information regarding population structure, behaviour, or demographic characteristics. Therefore, researchers increasingly recommend integrating eDNA analysis with remote sensing technologies, ecological field surveys, conventional taxonomy, and ecological modelling approaches to develop more accurate and reliable biodiversity monitoring systems.
3.6 In situ sensor networks
In situ sensor networks - including acoustic recorders, camera traps, microclimate sensors and GPS-enabled animal tags - generate continuous, fine-scale observations of species presence, behaviour and environmental conditions. Acoustic sensors enable the monitoring of vocal species such as birds, amphibians and insects, while camera traps provide critical data on terrestrial mammals and elusive species (Kays et al. 2015).
When integrated with geospatial datasets, these sensor networks create hybrid monitoring systems that combine organism-level observations with landscape-level environmental context. Such integrative approaches allow more robust analyses of species-environment relationships and support scalable, long-term biodiversity monitoring frameworks (Jetz et al. 2019).
A wide range of geospatial technologies has been adopted for biodiversity monitoring and ecological assessment, with each approach providing distinct advantages and constraints in relation to data acquisition, spatial resolution, analytical capability, and environmental application. Table 1 presents a comparative overview of the major geospatial technologies used in biodiversity monitoring, emphasizing their principal applications, methodological strengths, limitations, and recent advancements.
| Technology | Major Applications | Key Advantages | Major Limitations | References |
|---|---|---|---|---|
| Optical Remote Sensing | Vegetation monitoring, habitat mapping, phenology analysis | Large-scale coverage and long-term monitoring capability | Sensitive to cloud cover and atmospheric interference | Torres et al. (2012); Matyukira and Mhangara (2024) |
| SAR/Radar Sensing | Forest biomass estimation, floodplain and land-cover monitoring | All-weather and day–night imaging capability | Complex signal interpretation and processing | Han et al. (2024); X. Zhang et al. (2023) |
| LiDAR | 3D canopy structure and habitat complexity assessment | Highly accurate vertical vegetation characterization | High operational and processing costs | Matyukira and Mhangara (2024); Han et al. (2024) |
| UAV/Drone Mapping | Fine-scale habitat mapping and wildlife surveys | Ultra-high spatial resolution and flexible deployment | Limited spatial coverage and battery life | Han et al. (2024); X. Zhang et al. (2023) |
| eDNA Sampling | Detection of rare, cryptic and aquatic species | Highly sensitive and non-invasive biodiversity detection | Risk of contamination and protocol variability | Takahashi et al. (2023); Schenekar (2023) |
| Camera Traps & Acoustic Sensors | Wildlife monitoring and behavioural studies | Continuous automated monitoring of elusive fauna | Large data volumes requiring intensive processing | Rahmati (2024) |
4 Analytical advancements: AI, machine learning and data fusion
By making it possible to effectively extract ecological information from massive, intricate, and multidimensional datasets, recent developments in artificial intelligence (AI) and machine learning (ML) have completely changed geospatial studies in biodiversity science. The high-dimensional interactions and non-linear correlations present in ecological systems are frequently difficult for traditional statistical methods to grasp. On the other hand, ML algorithms may immediately learn intricate patterns from data, enhancing scalability and prediction performance in applications related to biodiversity monitoring (Olden, Lawler, and Poff 2008; Christin, Hervet, and Lecomte 2019).
4.1 Convolutional Neural Networks (CNNs)
The automatic classification of habitats, plant types, and individual animals in remotely sensed pictures is now mostly dependent on Convolutional Neural Networks (CNNs), a class of deep learning models especially ideally adapted for image analysis. From high-resolution aerial and satellite data, CNN-based methods have proven to be highly accurate in recognizing tree species, detecting canopy gaps, and classifying land-cover categories, significantly minimizing the need for human interpretation (Zhu et al. 2017; Maxwell, Warner, and Fang 2018). Deep learning models have been effectively used in wildlife monitoring to identify and categorize large animals in camera-trap and aerial picture datasets, increasing survey reproducibility and efficiency (Willi et al. 2019).
4.2 Embedded AI driven image analysis
AI-driven analysis of camera trap images and embedded vision cameras are revolutionary new methods in wildlife conservation that allow for effective, scalable species surveillance without continuous human supervision. They overcome the human picture review barrier that traditionally overwhelmed ecologists by combining machine learning and hardware developments to handle large image collections in real-time or nearly real-time.
With integrated CPUs (such as those from NVIDIA Jetson or Intel Movidius) housed in small, waterproof cases, embedded vision cameras enable on-device AI inference without requiring cloud access. In remote locations, this configuration saves battery life and bandwidth by capturing motion-triggered photos or video, running detection algorithms instantaneously, and flagging pertinent wildlife events. These work in perfect harmony with conventional camera traps, which are frequently infrared-enabled for night vision.
4.3 Ensemble machine learning methods
In addition to deep learning, habitat suitability evaluations and species distribution modeling (SDM) frequently employ ensemble machine learning techniques including Random Forests, Gradient Boosting, and Boosted Regression Trees. When incorporating heterogeneous predictor variables as spectral indices, topographic metrics, and vegetation structural characteristics, these models perform very well. Particularly in data-rich situations, ensemble ML techniques consistently outperform classic regression-based SDMs by accounting for non-linear responses and interactions among predictors (Elith, Leathwick, and Hastie 2008; Cutler et al. 2007).
4.4 Data fusion
By combining data from many geospatial sensors and environmental data sources, data fusion is a complementary analytical development that improves biodiversity modeling. The simultaneous assessment of vegetation composition, structure, and moisture conditions is made possible by combining optical, radar, and LiDAR information. The addition of meteorological and hydrological variables further contextualizes the relationships between species and their environments. In habitat mapping and biodiversity assessments, multi-sensor data fusion has been demonstrated to lower model uncertainty and increase predictive accuracy, especially in structurally complex and heterogeneous ecosystems like mangroves, coral reefs, and mountainous forests (Rocchini et al. 2016; Fassnacht et al. 2016).
The computational demands of AI-driven and data-fusion approaches have been greatly alleviated by the emergence of cloud-based geospatial platforms. Environments such as Google Earth Engine and the European Space Agency’s cloud infrastructures enable rapid access to global-scale, multi-temporal remote sensing archives and support parallel processing of large datasets. These platforms allow computation-intensive machine learning workflows to be implemented at regional to continental scales, facilitating reproducible biodiversity analyses and near-real-time ecological monitoring (Gorelick et al. 2017). Collectively, advances in AI, machine learning and data fusion are enabling a paradigm shift in biodiversity science-from static, site-based analyses toward scalable, integrative and predictive ecological modelling frameworks.
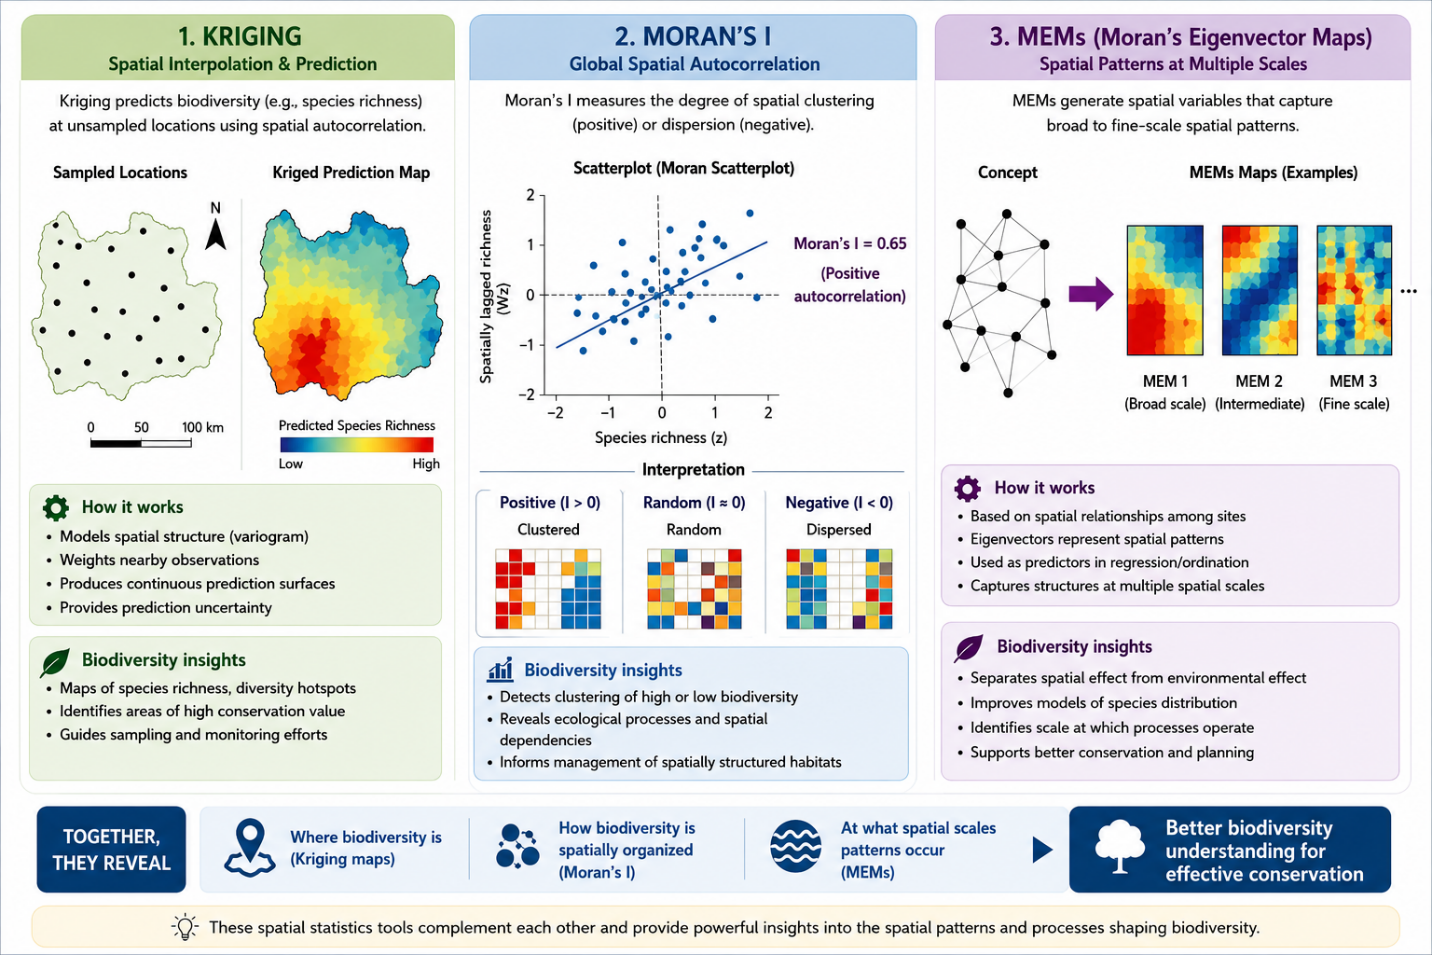
5 Spatial statistics - Kriging, Moran’s I, and MEMs in biodiversity insights
Spatial statistics provide essential tools for analyzing patterns in biodiversity data, such as species richness, across geographic spaces. Kriging uses sparse data to forecast values at unsampled places, whereas Moran’s I measure general dispersion or clustering. Directional biases (anisotropy) in landscape features such as rivers and mountains are further addressed by Moran’s eigenvector mappings (MEMs).
5.1 Kriging for interpolation
Kriging is a geostatistical technique that takes spatial covariance into account while creating continuous surfaces from point data. It is ideal for predicting values like species richness across unsampled locations from sparse biodiversity data. It minimizes prediction error through best linear unbiased prediction (BLUP) by using a variogram model to give closer observations more weight. While universal kriging takes into account trends like elevation gradients in species richness mapping, ordinary kriging assumes a constant mean. (Stein 2012)
An innovative Bayesian spatial statistical method for interpolating sparsely measured two-dimensional geospatial data using Sparse Representation Kriging (SR-Kriging) is presented in the work by Miao and Wang (2026). By explicitly including statistical uncertainty of covariance parameters in the kriging framework-a factor that is frequently overlooked in traditional kriging techniques-the research significantly advances spatial statistics. The suggested method offers a more objective and dependable interpolation solution for sparse geographical datasets by eschewing detrending and semi variogram fitting. The combination of Gibbs sampling and hierarchical Bayesian modeling improves prediction reliability and uncertainty quantification. The method is very useful for applications in environmental statistics, geostatistics, agriculture, and spatial prediction studies since simulation and real-data analyses show that it successfully reconstructs geographical variability while offering realistic confidence intervals.
Kriging treats the data as a regionalized variable, consisting of both spatially linked random fluctuation and deterministic trend, in order to estimate continuous surfaces from scattered point observations. In contrast to more straightforward techniques like inverse distance weighting (IDW), it uses a variogram to represent how similarity diminishes with distance in order to extract optimal weights from the empirical spatial structure of the data. This produces variance estimates (kriging standard error), which measure uncertainty at each site and are essential for conservation mapping where sample gaps are frequent.
In biodiversity contexts, kriging interpolates sparse eDNA samples or field surveys to estimate richness across forests, aiding hotspot delineation. Cross-validation assesses accuracy through metrics like mean squared error (MSE).
In conservation, kriging creates heatmaps for hotspots in fragmented ecosystems like Kerala’s Western Ghats by filling in gaps in GBIF occurrence data or drone-sampled richness. It outperforms splines in heterogeneous terrains by interpolating soil nutrients or canopy height that affect plant variety. It optimizes habitats in rice fields by mapping pollinator concentrations using trap counts for precision agriculture ties.
5.2 Moran’s I for clustering detection
In order to determine whether similar values (high species richness) cluster together, Moran’s I evaluates global spatial autocorrelation:
\[I = \frac{N}{W} \cdot \frac{\sum_{i=1}^{N} \sum_{j=1}^{N} w_{ij} (x_i - \bar{x})(x_j - \bar{x})} {\sum_{i=1}^{N} (x_i - \bar{x})^2}\]
where,
- \(N\) is the number of spatial units indexed by \(i\) and \(j\);
- \(x\) is the variable of interest;
- \(\bar{x}\) is the mean of \(x\);
- \(w_{ij}\) are the elements of a matrix of spatial weights with zeroes on the diagonal (i.e., \(w_{ii} = 0\));
- and \(W\) is the sum of all \(w_{ij}\), i.e., \(W = \sum_{i=1}^{N} \sum_{j=1}^{N} w_{ij}\)
Positive I (>0) indicates clustering (e.g., high richness in biodiversity hotspots); negative suggests dispersion; I=0 implies randomness. A z-score and p-value test significance via Monte Carlo permutations.
Apply to raster cells or polygons for species richness; clustered patterns show environmental factors such as soil fertility, which are frequently seen in plant population studies where Moran’s I performs better than other indices.
Local Moran’s I (LISA) identifies hotspots (high-high clusters) and coldspots, visualized in cluster maps for targeted conservation.
5.3 Moran’s eigenvector maps for anisotropy
MEMs capture patterns at various sizes by breaking down spatial correlations from a distance matrix into orthogonal eigenvectors. Negative eigenvalues deal with discontinuities, while positive eigenvalues model clustering. They explicitly represent anisotropy from irregular landscapes such as Kerala’s Western Ghats by regressing against response variables (such as richness) as predictors in GLMs (Dray, Royer-Carenzi, and Calenge 2010).
Using stream diatoms as model organisms, Leboucher et al. (2020) presented a unique metacommunity-based methodology for identifying species impacted by mass effect in freshwater environments. In order to differentiate mass effect from dispersion limitation and species generalism, the study included asymmetric eigenvector mapping (AEM), species co-occurrence analysis, and niche breadth estimation. The results showed those species impacted by the mass effect had comparatively small ecological niches, weak negative co-occurrence patterns, and substantial spatial dependence. The scientists also noted that a number of these species are included in widely used diatom-based bioassessment indexes, suggesting that the bulk effect may distort assessments of water quality and mask local environmental conditions. The study makes a significant addition to the knowledge of dispersal-driven community assembly processes in river ecosystems and to the improvement of ecological monitoring.
Significant MEMs are found using forward selection (fine-scale for local variation, broad-scale for regional trends). By eigen-decomposing connection graphs (e.g., Gabriel, relative neighborhood), this performs better than ordinary coordinates.
MEMs link spatial autocorrelation to habitat diversity in agro-biodiversity by revealing structuring in crop-edge-oak transitions.
6 Conservation applications of geospatial technologies
Geospatial technologies are now central to modern conservation, enabling systematic, large-scale, and repeatable monitoring of ecosystems and biodiversity. Satellite remote sensing is widely used to detect illegal land-use change, deforestation, and forest degradation. Near-real-time data supports enforcement, policy evaluation, and adaptive management. Long-term Earth observation datasets help quantify habitat loss, identify deforestation hotspots, and assess cumulative human impacts across protected and unprotected landscapes (Hansen et al. 2013; Turner et al. 2015). LiDAR and UAV-based surveys provide high-resolution structural data, enabling fine-scale assessment of habitat quality and complexity. They are especially valuable for restoration and species recovery by identifying microhabitats, nesting sites, and key structural features for sensitive species. LiDAR metrics such as canopy height, vertical heterogeneity, and gap distribution support prioritizing restoration and evaluating outcomes (Davies and Asner 2014). UAVs offer flexible, cost-effective monitoring and help validate satellite data at local scales.
Geospatial technologies enhance protected area management by tracking ecological trends, mapping invasive species spread, and quantifying landscape connectivity. Remote sensing–based analyses of fragmentation and connectivity support corridor planning and landscape-scale conservation to maintain functional ecological networks (Saura et al. 2018). These approaches are crucial in human-dominated landscapes where biodiversity depends on connectivity among remaining habitats. In fire-prone ecosystems, satellite thermal sensors and burned-area products are essential for monitoring wildfires. Near-real-time detection enables rapid response, while multi-temporal data support modelling of fire regimes, severity, and recurrence. This information is vital for conserving fire-sensitive ecosystems and developing climate-adaptive fire management strategies (Giglio, Schroeder, and Justice 2016; Bowman et al. 2020).
Conservation applications have expanded by integrating environmental DNA (eDNA) with remote sensing. Georeferenced eDNA improves species distribution models by detecting rare, cryptic, and aquatic species when combined with environmental variables. These approaches enable more accurate habitat mapping and guide targeted actions such as species reintroduction and habitat protection (Deiner et al. 2017; Ruppert, Kline, and Rahman 2019). Overall, geospatial technologies have shifted conservation from reactive, site-based approaches to proactive, spatially explicit, data-driven management at ecologically meaningful scales.
7 Limitations, biases and the role of ground truthing
Geospatial technologies for monitoring biodiversity have a number of methodological and biological limitations that must be carefully taken into account in conservation applications, notwithstanding their transformational potential. Particularly in tropical and montane locations, atmospheric interference including cloud cover, haze, and fluctuating illumination can limit data availability and create temporal gaps in optical remote sensing. Furthermore, limited spectral resolution and sensor saturation in dense vegetation might make it difficult to distinguish between structurally identical habitats, which lowers sensitivity to minute ecological variation (Rocchini et al. 2016; Pettorelli et al. 2014). A key limitation of geospatial biodiversity assessments is the reliance on habitat proxies rather than direct species detection. While vegetation indices, land-cover data, and structural metrics indicate habitat suitability, they do not reliably capture species presence, abundance, or behavior. As a result, they may misrepresent biodiversity patterns or miss rare, cryptic, or low-density species, especially where species–habitat relationships are weak or context-dependent (Turner et al. 2015).
Ground truthing with field observations remains essential to ensure ecological validity. In situ surveys are needed to train models, and to calibrate and validate remotely sensed data. They also capture ecological details such as species interactions, phenology, understory composition, and fine scale disturbances that are difficult to detect remotely (Fassnacht et al. 2016). Without systematic ground validation, models risk propagating unverified assumptions across large spatial scales. Geospatial biodiversity analyses are often biased by uneven spatial and temporal data coverage. Tropical regions, despite high biodiversity, face challenges such as persistent cloud cover, limited sensor penetration, and scarce field data, while global datasets remain skewed toward temperate regions. This can lead to underrepresentation of biodiversity hotspots and increased uncertainty in global estimates (Meyer, Weigelt, and Kreft 2016; Jetz et al. 2019). Algorithmic bias in AI and machine learning models is a key challenge. Models trained on unbalanced or spatially biased data often perform poorly in data scarce regions or for underrepresented taxa. The opaque nature of deep learning can also limit error detection and ecological interpretation. Addressing this requires transparent model design, rigorous validation with independent datasets, and explicit treatment of bias and uncertainty (Christin, Hervet, and Lecomte 2019). Overall, while geospatial technologies offer powerful tools for large scale biodiversity monitoring, their effectiveness depends on integrating field data, critically addressing biases, and sustaining ground truthing. Such hybrid approaches are essential for generating reliable, ecologically meaningful insights to support conservation decisions in a changing environment.
8 Ethical, legal and governance considerations
In order to ensure responsible use in biodiversity conservation, a number of ethical, legal, and governance issues have been brought about by the quick development of geospatial technology and high resolution Earth observation systems. Increasing geographical and temporal resolution makes it possible to monitor infrastructure, human activity, and landscapes in great detail, but it also raises questions about permission, privacy, and the abuse of surveillance powers. When monitoring takes place in or close to populated regions, culturally significant landscapes, or indigenous territories, these worries are especially severe since spatial data may unintentionally reveal private information or compromise local autonomy.
A key governance concern in the application of geospatial technology for conservation is data sovereignty. Although local communities and indigenous peoples frequently have long standing guardianship relationships with biodiverse landscapes, foreign organizations regularly gather, analyze, and store remotely sensed data about these locations. Such techniques run the risk of marginalizing local knowledge systems and going against the concepts of free, prior, and informed consent in the absence of suitable governance frameworks. The need for data governance models that respect cultural landscapes, acknowledge indigenous rights, and guarantee local communities have significant control over the creation and use of spatial data pertaining to their territories is highlighted by recent conservation scholarship (Kukutai and Taylor 2016; Garnett et al. 2018). Another difficulty is striking a balance between ethical protections and open data policies. Transparency, reproducibility, and international conservation cooperation have all benefited from open access to geospatial data. Unrestricted data sharing, however, may potentially undermine culturally sensitive locations, enable illicit operations like poaching or land grabbing, and expose fragile species to exploitation. Therefore, rather than implementing uniform openness across all datasets, effective governance necessitates sophisticated data-sharing frameworks that differentiate between various levels of sensitivity and risk.
Another important factor is equity in access to geospatial technologies. While improved sensors, cloud computing infrastructure, and analytical skills are becoming more and more beneficial to high income nations, many biodiversity rich places in the Global South continue to encounter obstacles relating to cost, technical capacity, and digital infrastructure. This disparity runs the danger of increasing the conservation capacity gap, whereby areas that require biodiversity monitoring the most are least able to use or profit from state of the art GIS techniques. Sustained investment in technology transfer, capacity building, and inclusive collaborations that empower regional institutions and researchers are necessary to meet this problem.
Lastly, the ethical use of geospatial technology necessitates accountability and transparency in analytical processes, especially when conservation decisions with social ramifications are informed by AI-driven models. To guarantee that geographic results are accurately interpreted and do not unintentionally reinforce current power asymmetries or governance failures, it is crucial to clearly identify data sources, assumptions, and uncertainties. In order to integrate technical innovation with social justice and long-term sustainability goals, geospatial conservation practice must incorporate ethical, legal, and governance considerations.
9 Emerging frontiers
The future course of biodiversity monitoring is being redefined by the rapid advancements in genetic ecology, data science, and Earth observation. The creation of planetary-scale biodiversity observation systems that smoothly combine satellite, aerial, in situ, and genomic data streams is a top research objective. In order to enable earlier identification of biodiversity loss and more prompt conservation actions, such systems seek to go beyond static mapping toward continuous, near-real-time evaluation of ecosystem state and change (Jetz et al. 2019).
Another crucial area is enhancing the resilience and transferability of AI models across geographical areas and biomes. When applied to new ecosystems, many of the AI-based classifiers and species distribution models in use today perform worse since they were trained on geographically restricted datasets. In order to improve generalizability and interpretability, research is increasingly concentrated on domain adaptation, transfer learning, and hybrid mechanistic-statistical models that combine ecological theory with data-driven methods (Brun et al. 2024; Thuiller et al. 2019).
Another urgent goal is the standardization of geospatial-biodiversity procedures. Reproducibility, comparability, and uncertainty propagation issues have arisen as a result of the expansion of sensors, platforms, and analytical pipelines. In order to guarantee that biodiversity indicators obtained from remote sensing are consistent and policy-relevant across geographical and temporal scales, international efforts now prioritize the harmonization of data formats, metadata standards, and validation processes (Pettorelli et al. 2014).
An emerging application with significant conservation significance is operational early-warning systems for ecological tipping points. These systems seek to identify indicators of ecosystem stress, such as diminishing vegetation resilience, changed phenology, or rising disturbance frequency, before irreversible deterioration takes place by combining multi-sensor remote sensing, climate data, and ecological models. Early-warning frameworks are increasingly explored for forests, coral reefs, drylands and polar ecosystems, where rapid environmental change poses acute risks to biodiversity (Dakos et al. 2019; Verbesselt et al. 2016).
In the future, it is anticipated that technological advancements such autonomous robotic platforms, nanosatellite constellations, and sophisticated sensing modalities would improve the temporal resolution and spatial coverage of biodiversity surveys. Even though many of these technologies are still in their infancy, integrating them with current monitoring networks could lead to more adaptable and responsive conservation tactics (Jetz et al. 2019). Sustained investment in training, capacity building, and fair access to geospatial infrastructure is also crucial. Without such initiatives, the advantages of technological advancement run the risk of becoming concentrated in a small number of areas, undercutting the goals of global biodiversity conservation.
10 Conclusion
By enabling continuous, scalable, and multidimensional observation of ecological systems at local to global scales, geospatial technologies have completely changed biodiversity monitoring. Biodiversity patterns and ecosystem dynamics may now be evaluated with previously unheard-of spatial coverage and temporal consistency because to developments in satellite remote sensing, aerial platforms, in situ sensor networks, and cloud-based analytical infrastructures. The constraints of conventional field-based surveys, which are crucial but still limited in their capacity to record swift and extensive environmental change, are immediately addressed by these capabilities (Pettorelli et al. 2014).
A significant conceptual change in conservation research is represented by the combination of geographical data with cutting-edge methods like environmental DNA, artificial intelligence, and community-based observations. When combined, these technologies make it possible to identify species and ecological processes that would otherwise be challenging to see, such as cryptic, uncommon, or nocturnal creatures, early indicators of habitat degradation, and minute alterations in the structure and function of ecosystems (Jetz et al. 2019). The predictive power of biodiversity models is further improved by machine learning and data-fusion approaches, which support early-warning systems for ecosystem collapse and proactive conservation planning (Brun et al. 2024).
Despite advances, several challenges remain in translating digital insights into conservation action. Issues of privacy, data sovereignty, and equitable use of high-resolution geospatial data require strong governance, ethical safeguards, and open data practices. Continued investment in capacity building, especially in biodiversity-rich regions of the Global South, is essential to avoid widening conservation inequalities (Pettorelli et al. 2014). Effective interpretation of remotely sensed data also depends on interdisciplinary collaboration and field-based validation. Ultimately, conservation success relies not just on technological advancement, but on the responsible integration of geospatial tools with ecological knowledge, local participation, and ethical stewardship. When applied in this way, geospatial technologies can strongly support biodiversity conservation and ecosystem resilience in a rapidly changing world.
References
Publication Information
- Submitted: 20 March 2026
- Accepted: 25 May 2026
- Published (Online): 01 June 2026
Reviewer Information
Reviewer 1:
Dr. S. Vishnu Shankar
Teaching Assistant
Tamil Nadu Agricultural University, CoimbatoreReviewer 2:
Anonymous
The statements, opinions and data contained in all publications are solely those of the individual author(s) and contributor(s) and not of the publisher and/or the editor(s).
The publisher and/or the editor(s) disclaim responsibility for any injury to people or property resulting from any ideas, methods, instructions or products referred to in the content.
© Copyright (2026): Author(s). The licensee is the journal publisher. This is an Open Access article distributed under the terms of the Creative Commons Attribution-NonCommercial-NoDerivatives 4.0 International License, which permits non-commercial use, sharing, and reproduction in any medium, provided the original work is properly cited and no modifications or adaptations are made.