Optimal Nitrogen and Phosphorus Fertiliser Rates for Maximising Food Barley Productivity in the Highlands of North Gondar, Ethiopia
Soils in the Ethiopian highlands are deficient in nitrogen (N) and phosphorus (P), limiting food barley productivity over many decades. This study determined the optimum N and P fertiliser rates for food barley production in the Central and North Gondar highlands of Ethiopia. Read more …

Soils in the Ethiopian highlands are deficient in nitrogen (N) and phosphorus (P), limiting food barley productivity over many decades. This study aimed to determine the optimum N and P fertiliser rates for food barley production in the Central and North Gondar highlands of Ethiopia. Field experiments were conducted during the 2019 and 2020 cropping seasons at six sites using a randomized complete block design with three replications. Treatments comprised four N rates (46, 69, 92, and 115 kg ha-1) and three P2O5 rates (23, 46, and 69 kg ha-1). The highest grain yields ranged from 2650.6 to 4160.8 kg ha-1 across sites with 115 kg N ha-1, while the highest combined mean yield (3150.8 kg ha-1) was also obtained at this rate. However, partial budget analysis identified 92 kg N ha-1 and 23 kg P2O5 ha-1 as the most economically profitable fertiliser combination, recommended for food barley production.
Food-barley, Nitrogen-fertiliser, Phosphorus-fertiliser, Partial-budget-analysis, Soil-fertility, Ethiopian-highlands
1 Introduction
As in many other tropical and subtropical regions (Sanchez 1976), soils in the highlands of Ethiopia usually have low levels of essential plant nutrients and organic matter content; especially low availability of N and P has been demonstrated to be a major constraint to crop production in Ethiopia (Mamo et al. 1988). This is largely a consequence of the cereal-dominated mono-cropping system, resulting in continuous nutrient mining through removal by plants and no consideration for the replenishment through the application of either mineral or organic fertiliser sources (Agegnehu and Amede 2017).
Barley is an important cereal crop in the highlands of North and Central Gondar Zones in Ethiopia. It occupies a large area of cultivated land in these areas. Smallholder farmers mainly grow barley under rain-fed conditions. In the highlands of Gondar, barley covers about 46155.9 ha. It is commonly grown on most household plots. Each household usually grows barley on about 0.01–0.25 ha of land (Tadesse and Derso 2019). Barley is strongly linked to farmers in the area. It plays an important role in supporting household food security.
The grain yield potential of released food barley varieties that are under production in Ethiopia ranges from 2270 to 6100 kg ha-1 (Haile 2018). Although barley is important as a food and feed crop in Ethiopia and efforts have been made so far to generate improved production technologies, its national average productivity (2177 kg ha-1) has remained very low based on figures from the Central Statistical Agency (Central Statistical Agency 2019). For the past several years, farmers in the country had used the blanket recommendation of only N and P fertiliser sources as an input to improve soil fertility and increase crop production, including food barley. Similarly, the majority of farmers use fertilisers for their barley fields in the Dabat, Debark and Wogera highlands (Tadesse and Derso 2019). However, the blanket recommendation lacks the right rates for those fertiliser types.
There was no research conducted to determine site-specific fertiliser rate recommendations for food barley production in the Central and North Gondar highlands. As a result, the farmers and development agents (DAs) rely on old fertiliser recommendations that are very general across the country. Therefore, there is a need to study the influence of different N and P rates on the productivity of food barley, to ascertain the economically optimum N and P rates for food barley production in the highlands of the Central and North Gondar Zones.
2 Materials and methods
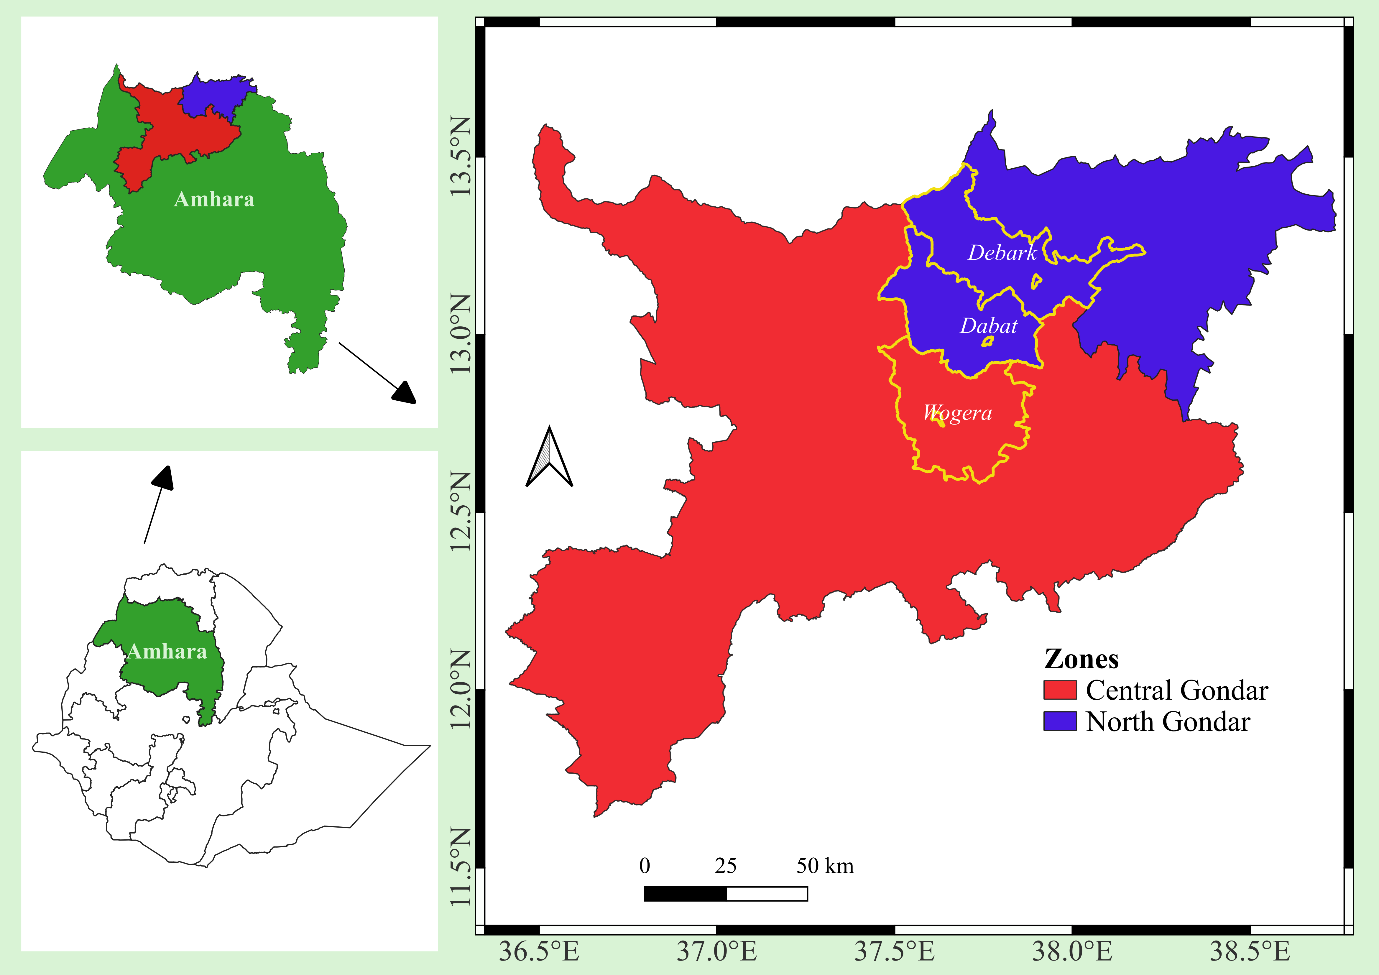
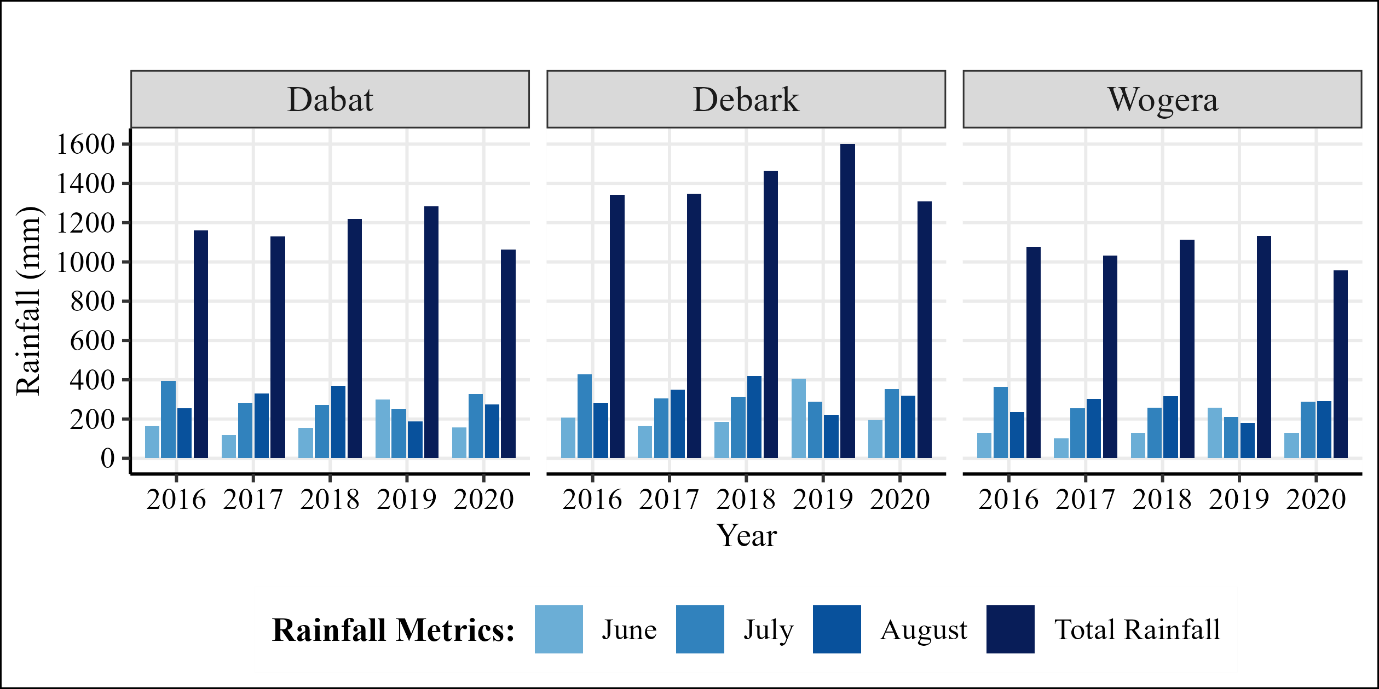
The field experiments were conducted in 2019 and 2020 during the main rainy season in Wogera, Dabat and Debark districts of the Central and North Gondar Zone administration in the Amhara National Regional State, Ethiopia (Figure 1). According to the FAO soil classification, the dominant soil type in those areas is cambisol. Cambisols are young soils with lower phosphorus fixation compared to highly weathered soils. They can contain up to 65% soluble P of total soil P (Lemos et al. 2022). The climatic data for the study districts were compiled for the last five (2016-2020) consecutive years from National Aeronautics and Space Administration (NASA). As shown in Figure 2, the areas received from 958 mm to 1620 mm of total annual rainfall during the last 5 years (NASA 2019).
The treatments were laid out in a randomized complete block design with three replications. In the first year (2019), the experiment comprised 13 treatments in a factorial combination of four levels of N (46, 69, 92 and 115 kg ha-1) and three levels of P2O5 (23, 46 and 69 kg ha-1); besides, one satellite treatment (0 N and 0 P2O5) was observed. However, in the second year (2020), the satellite treatment was excluded and the 0 P2O5 level (additional 4 treatments from the factorial) was included in the factorial combination. Thus, the experiment considered 16 treatments in a factorial combination of four levels of N (46, 69, 92 and 115 kg ha-1) and four levels of P2O5 (0, 23, 46 and 69 kg ha-1). The rationale for modification of the treatments in the second year was to confirm the significance of P fertiliser application because all sites in the first year gave non-significant grain yield differences among the main effect of P2O5 (23, 46, and 69 kg ha-1). The experiment was done on five sites at Dabat (site 1 and site 4), Debark (site 3 and site 5), and Wogera (site 2) districts in 2019. In addition, it was conducted at a sixth site located in Dabat district in 2020.
For the combined analysis across all six sites, the statistical model considered only the 12 core factorial treatments by dropping the satellite treatment from the first year and the 0 P2O5 level (four treatments) from the second year. This approach was used to maintain a balanced, common treatment structure shared uniformly across all experimental sites, thereby preventing analytical bias in the combined analysis of variance (ANOVA).
The gross plot size was 3 m x 3 m = 9 m² and spacing between plots and replication was 1 m and 1.5 m, respectively. Triple Super Phosphate (TSP) was used as a source of P, and urea was used as a source of N as indicated in the treatments. Based on nutrient composition, TSP contains 0% N, 46% P2O5, and 0% K2O, while urea contains 46% N, 0% P2O5, and 0% K2O. All doses of TSP fertiliser were drilled in furrows at the time of sowing, and half of N was added at planting and the remaining half after 45 days of planting. Debark 1 food barley variety was used with a seed rate of 125 kg ha-1. Before planting, soil samples were collected from about 10 sub-sampling spots and 0-30 cm soil depths, and then one composite soil sample was made for each experimental site.
The soil samples were air-dried, ground, and sieved for the determination of parameters of pH, total N, available P, soil particle size distribution, organic carbon (OC), and cation exchange capacity (CEC). The distribution of soil particle size was determined by the hydrometer method (Bouyoucos 1951). The soil pH was measured with a digital pH meter potentiometrically in a supernatant suspension of a 1:2.5 soil to distilled water ratio (Van Reeuwijk 2002). The organic carbon (OC) was determined by the dichromate oxidation method (Walkley and Black 1934). The total N in the soil was measured by the micro Kjeldahl method (Jackson 1958). Cation exchange capacity (CEC) was determined by the 1M ammonium acetate method at pH 7 (Chapman 1965). Available P was analysed by the Olsen method (Olsen et al. 1954). The soil samples were analysed at the Gondar soil testing laboratory.
| Experimental sites | TN (%) | Av. P (ppm) | Sand (%) | Clay (%) | Silt (%) | Textural class | pH (H2O) | OC (%) | CEC Cmol /kg + Ammon. Acet |
|---|---|---|---|---|---|---|---|---|---|
| Site 1 | 0.31 | 38.07 | 26.72 | 32 | 41.28 | Clay loam | 5.70 | 2.41 | 42.63 |
| Site 2 | 0.27 | 73.29 | 26.72 | 32 | 41.28 | Clay loam | 6.24 | 1.91 | 50.20 |
| Site 3 | 0.21 | 21.88 | 28.72 | 34 | 37.28 | Clay loam | 5.72 | 2.19 | 37.73 |
| Site 4 | 0.35 | 10.68 | 24.72 | 44 | 31.28 | Clay | 6.08 | 2.49 | 40.90 |
| Site 5 | 0.27 | 56.24 | 46.72 | 20 | 33.28 | Loam | 5.74 | 1.43 | 45.30 |
| Site 6 | 0.31 | 38.07 | 26.72 | 32 | 41.28 | Clay loam | 5.70 | 2.41 | 42.63 |
According to the rating scale established by (Tadesse et al. 1991), the pH of site 1, site 3 and site 5 were moderately acidic soils; site 2 and site 4 were slightly acidic; the soil Organic Carbon (OC) content of all sites was moderate, except site 5 (low). Total N from all sites was high, except site 3 (moderate); available P from site 1, site 2, and site 5 was very high; site 3 (high) and site 4 (medium); and cation exchange capacity (CEC) from all sites was high (Table 1).
The following agronomic data were collected on 6 experimental sites. Plant height and spike length were recorded from 10 randomly selected plants from the net plot area at harvest. Plants harvested close to the ground surface from the net plot were sun-dried in the open air and weighed to determine the aboveground biomass yield. Grain yield was determined after adjusting the actual grain yield at the appropriate moisture level of 12.5%. The weight of a thousand seeds was determined by weighing 1000 randomly selected grains and weighing with a sensitive balance and adjusting to a moisture level of 12.5%.
The collected data were analysed by SAS version 9.4 statistical software using the general linear model (GLM) procedure after checking the compliance of the data with the assumptions of the statistical test. Comparisons among treatment means with a significant difference for measured parameters were done using least significant difference (LSD) at a 5% probability level. The partial budget analysis was done using the procedures outlined by International Maize and Wheat Improvement Centre (CIMMYT 1988).
For economic analysis, the variable cost of fertilisers was taken at the time of planting. Yield from experimental plots was adjusted downwards by 10% for management differences. The return was calculated as total gross return minus total variable cost. All costs and revenues were valued in Ethiopian birr (ETB). During planting time, the field grain yield price of food barley was 22 ETB kg-1, the price of straw was 2 ETB kg-1, the market price of TSP was 14.7 ETB kg-1, and the market price of urea was 15 and ETB kg-1, which were used for variable cost determination. The partial budget analysis was conducted specifically for the main effect of Nitrogen on the combined yield of food barley, rather than for Phosphorus. Because the main effect of P did not show statistically significant differences among the treatments on the combined yield of food barley, the lowest and most cost-effective P fertiliser rate was recommended for the area.
Net benefits and costs that vary between treatments were used to calculate the marginal rate of return to invested capital as we move from a less expensive to a more expensive treatment. In this study, a 100% return on the investments was used as a reasonable minimum acceptable rate of return.
Marginal analysis was done by un-dominated treatments to make a recommendation. Which is the process of calculating marginal rates of return (change in net benefit divided by change in total cost) between treatments, proceeding in steps from a lower cost treatment to that of the next higher cost, and comparing those rates of return to the minimum rate of return (100%) acceptable to farmers. The purpose of marginal analysis is to reveal just how the net benefits from food barley yield increase as the amount of N application increases. If these values continue to fall, then the analysis can be stopped at the last treatment that has an acceptable rate of return compared to the treatment of the next lowest cost (CIMMYT 1988).
For the benefit-cost ratio analysis of food barley production, both fixed and variable costs were considered. The benefit-cost ratio (B:C) was calculated by dividing the gross benefit by the total cost of production. The fixed costs included land rent, tillage, sowing, seed price, fertiliser application, weeding, harvesting, and threshing. Land rent was 12,000 ETB ha-1. The land was tilled three times using the total number of 12 labour-days and 24 oxen-days ha-1. Sowing, fertiliser application, weeding, harvesting, and threshing required 8, 2, 200, 20, and 4 labour-days ha-1, respectively, while threshing also required 10 oxen-days ha-1. Improved barley seed was applied at 125 kg ha-1, with a seed price of 25 ETB kg-1. The cost of both labour and one ox was 100 ETB per day for all field activities. Since the lowest P rate (23 kg ha-1 P2O5) is recommended, the cost of TSP was included in the fixed costs when calculating the benefit-cost ratio for the nitrogen treatments. Therefore, a total fixed cost of 43860 ETB ha-1 was used for the benefit-cost analysis of the N treatments.
3 Results
3.1 Effects of N and P on food barley yield
The analysis of variance (ANOVA) result showed that the effect of different N rates significantly (\(p \leq 0.01\)) affected the grain yield (GY) of food barley at all experimental sites. All experimental sites showed a progressive increase in grain yield in response to increased rates of nitrogen except site 2. However, there was no significant effect among P rates and their interaction with N (Table 2). The grain yield with no application of NP (0, 0) fertilisers ranged from 689.78 to 1685.57 kg ha-1; but with the maximum N input (115 kg ha-1), the grain yield ranged from 2650.6 to 4160.8 kg ha-1 (Table 2 and Table 3). While the ANOVA result showed that the interaction effect of different N and P rates (modified) significantly (\(p \leq 0.05\)) affected the grain yield of food barley at the sixth experimental site in 2020.
| Treatments | Site 1 | Site 2 | Site 3 | Site 4 | Site 5 |
|---|---|---|---|---|---|
| N (kg ha-1) | |||||
| 46 | 2039.6b | 2138.20c | 1511.70c | 1434.7b | 2393.90d |
| 69 | 2502.4b | 2418.40bc | 2079.20bc | 1692.3b | 2893.00c |
| 92 | 2515.2b | 3158.40a | 2686.80ab | 2341.7a | 3741.50c |
| 115 | 3073.9a | 2962.00ab | 3230.30a | 2650.6a | 4160.80c |
| CD (\(\alpha = 0.05\)) | 546.25** | 633.50* | 614.82** | 393.54** | 318.55** |
| P2O5 (kg ha-1) | |||||
| 23 | 2432.7 | 2589.20 | 2241.70 | 2045.10 | 3123.80 |
| 46 | 2550.1 | 2486.30 | 2442.80 | 2056.10 | 3416.20 |
| 69 | 2615.5 | 2932.20 | 2446.50 | 1988.30 | 3351.90 |
| CD (\(\alpha = 0.05\)) | NS | NS | NS | NS | NS |
| CV (%) | 22.06 | 24.28 | 26.46 | 19.83 | 9.88 |
| Satellite (0,0) | 987.36 | 1505.28 | 689.78 | 1021.73 | 1685.57 |
Similar to the 2019 experimental sites no statistically significant average grain yield differences were observed among applications of 23, 46 and 69 kg ha-1 P2O5 ratesduring the 2020 cropping year (Table 3). The modified control treatment (0 kg P2O5 ha-1) produced a significantly lower grain yield than all phosphorus fertiliser application rates (Table 3). Therefore, the application of the lowest phosphorus rate (23 kg P2O5 ha-1) significantly increased the grain yield of food barley in the study area.
The combined ANOVA was done for six sites excluding the satellite treatment in 2019, and the zero level of P2O5 in 2020. The result showed that the application of different N rates significantly (\(p \leq 0.01\)) increased plant height (PH), spike length (SPL), above ground dry biomass (BM) and grain yield (GY); but it was not influenced thousand seed weight (TSW) of food barley.
| Treatments | P2O5 (kg ha-1) \(\Rightarrow\) | ||||
|---|---|---|---|---|---|
| N (kg ha-1) | 0 | 23 | 46 | 69 | Mean |
| 46 | 982.2i | 1133.2ghi | 1671.8efgh | 1616.9efghi | 1351.0c |
| 69 | 1750.9efg | 1988.5def | 1996.5cdef | 1935.5def | 1917.8b |
| 92 | 1068.6hi | 2236.7bcde | 2161.1cde | 2641.1abc | 2026.9b |
| 115 | 1494.0fghi | 2819.1ab | 2461.6bcd | 3201.2a | 2494.0a |
| CD (\(\alpha = 0.05\)) | 649.94* | ||||
| CV (%) | 20.01 | ||||
| Mean | 1323.9a | 2044.4b | 2072.8b | 2348.7b |
The tallest plant height (98.5 cm), the longest spike length (6.64 cm), the maximum above ground dry biomass (7974.19 kg ha-1), and grain (3150.83 kg ha-1) yield were recorded by application of 115 kg N ha-1 (Table 4). The result of the present study showed that the application of 92 kg N ha-1 had added 23.8% grain yield of food barley over the past N (69 kg ha-1) rate of recommendation by (Agegnehu et al. 2011). Likewise, the application of 115 kg N ha-1 had a 39.4% yield increment over the application of the previous N recommendation to food barley.
| Treatments | PH | SPL | BM | GY | TSW |
|---|---|---|---|---|---|
| N (kg ha-1) | |||||
| 46 | 86.36d | 5.79d | 5333.89d | 1832.01d | 42.01 |
| 69 | 90.69c | 6.03c | 6259.82c | 2259.79c | 42.62 |
| 92 | 95.86b | 6.40b | 7295.18b | 2798.33b | 41.51 |
| 115 | 98.50a | 6.64a | 7974.19a | 3150.83a | 41.67 |
| CD(\(\alpha = 0.05\)) | 1.73** | 0.18** | 421.80** | 162.21** | NS |
| P2O5 (kg ha-1) | |||||
| 23 | 92.21 | 6.23 | 6580.39b | 2412.83 | 41.62 |
| 46 | 92.53 | 6.21 | 6559.34b | 2504.05 | 42.07 |
| 69 | 93.83 | 6.20 | 7007.58a | 2613.84 | 42.17 |
| CD(\(\alpha = 0.05\)) | NS | NS | 365.29* | NS | NS |
| CV (%) | 6.13 | 7.47 | 18.25 | 20.28 | 6.01 |
The combined ANOVA of this study showed that there was no significant effect among P rates and their interaction with N but above ground dry biomass yield was significantly (\(p \leq 0.05\)) influenced by p rates (Table 4). The result showed that the application of the past (Agegnehu et al. 2011) P rate of recommendation (46 kg P ha-1) gave grain yield that was statistically at par with the application of 23 and 69 kg P2O5 ha-1. These results suggest significant potential for optimising input costs without sacrificing yield; reducing phosphorus application to 23 kg P2O5 ha-1 achieved statistically identical grain yields to both the older 46 kg P2O5 ha-1 recommendation (Agegnehu et al. 2011) and the higher 69 kg P2O5 ha-1 rate.
4 Partial budget analysis
The marginal rate of return (MRR) from this study showed that application of the three rates of N fertiliser (69, 92 and 115 N kg ha-1) gave greater than 100% return (which was used as a reasonable minimum acceptable rate of return) as compared with application of 46 N kg ha-1. The maximum net benefit (67318.48 ETB) with MRR of 908.96% was obtained from the application of 115 N kg ha-1 (Table 5). This means that for every 1.00 ETB invested in N fertiliser application to food barley production, farmers can obtain an additional 9.09 ETB in the Central and North Gondar highlands.
| N (kg ha-1) | AGY | Straw | GB (ETB) | TVC (ETB) | NB (ETB) | MB (ETB) | MC (ETB) | MRR (%) |
|---|---|---|---|---|---|---|---|---|
| 46 | 1648.81 | 3151.69 | 42577.18 | 1500.00 | 41077.18 | |||
| 69 | 2033.81 | 3600.03 | 51943.90 | 2250.00 | 49693.90 | 8616.71 | 750.00 | 1148.90 |
| 92 | 2518.50 | 4047.17 | 63501.26 | 3000.00 | 60501.26 | 10807.37 | 750.00 | 1440.98 |
| 115 | 2835.75 | 4341.02 | 71068.48 | 3750.00 | 67318.48 | 6817.22 | 750.00 | 908.96 |
Moreover, the control treatment (0 kg P2O5 ha-1) produced a significantly lower grain yield than all phosphorus fertiliser application rates (Table 3). Since the lowest phosphorus application rate (23 kg P2O5 ha-1) significantly increased grain yield while requiring the lowest fertiliser cost, it is recommended as the optimum phosphorus rate for food barley production in the study area.
The benefit-cost ratio (B:C) revealed an increasing trend with higher nitrogen application rates. The B:C values were 0.9, 1.1, 1.4, and 1.5 for 46, 69, 92, and 115 kg N ha-1, respectively. This indicates that increasing nitrogen rates improved the economic returns of food barley production, with the highest profitability observed at 115 kg N ha-1.
5 Discussions
According to the critical nutrient ranges adopted by the Ministry of Agriculture and Natural Resources (MoANR) and the Agricultural Transformation Agency (ATA) under the Ethiopian Soil Information System (EthioSIS), the initial soil results in site 3 and site 4 were below the optimum critical P range (30 ppm - 80 ppm). However, all sites were within optimum levels of the critical N range (0.15% - 0.3%) for most field crops (MoANR and ATA 2016). Nevertheless, a single point of critical nutrient concentration is difficult to establish experimentally; the critical point may vary under different conditions (Dow and Roberts 1982). Therefore, it looks desirable to deal with a critical nutrient range instead of a single concentration. Generally, for soil test interpretations to be valid, they must be calibrated under conditions similar to where they will be used and tailored to the specific crop being grown. Therefore, local calibrations are essential (Beegle 2011).
Furthermore, all experimental sites maintained available P concentrations well above the absolute biological critical minimum of 4.60 ppm calculated for food barley by (Eshetu et al. 2022) in similar highland environments. Therefore, P fertiliser recommendations in the study sites are generally for maintenance of P in the optimum range (Beegle 2011). This indicated that farmers had better use half of the past dose of P fertiliser recommended for food barley by (Agegnehu et al. 2011). According to (Cook and Davis 1957), soil test results on mineral soils show that P levels are building up in soils where crops are regularly fertilised. When the accumulation of P is rarely proportional, changes to the right rate of P fertiliser recommendation to crops become necessary to maintain soil P balance.
In agreement with this result, (Niguse and Kassaye 2018) reported that increased application of N on various varieties of food barley gave increased plant height, spike length, above ground dry biomass and grain yield. In contrast to the present finding, they also reported that increased application of N significantly influenced thousand seed weights. In addition, (Tigre et al. 2014) recorded that the highest total dry biomass on plots received 120 kg N ha-1 (8780 kg ha-1) and 69 kg P2O5 ha-1 (8910 kg ha-1), both N and P significantly influenced the total dry biomass of barley but their interaction effect was not significant. Similarly, (Mekonnen and W/kiros 2018) reported that increased application of P significantly influenced above ground dry biomass. In contrast, they also found that increased application of P fertiliser to food barley gave increased plant height, spike length and grain yield.
The interaction between nitrogen and phosphorus depends on the amount of each nutrient applied and the fertility status of the soil. (Tofa et al. 2022) reported that applying both nutrients together often improves crop performance because each nutrient helps the plant use the other more efficiently. In the present study, soil organic carbon decreased across the experimental sites, indicating low soil fertility and a greater need for nitrogen. This explains why grain yield continued to increase up to the highest nitrogen rate (115 kg N ha-1). In contrast, the phosphorus requirement of food barley was relatively low, as the lowest phosphorus rate (23 kg P2O5 ha-1) was sufficient to achieve maximum grain yield.
The significant N × P interaction observed at Site 6 was mainly due to the inclusion of the control treatment level (0 kg P2O5 ha-1). At this level, phosphorus deficiency limited crop growth, so increasing nitrogen alone could not improve yield. However, once phosphorus was applied at the lowest rate (23 kg P2O5 ha-1) this limitation was removed, allowing the crop to respond better to nitrogen. Increasing phosphorus beyond 23 kg P2O5 ha-1 (to 46 or 69 kg P2O5 ha-1) did not produce any additional yield benefit. This also explains why no significant N × P interaction was observed at the 2019 sites, where all treatments received at least 23 kg P2O5 ha-1 and therefore no severe phosphorus deficiency occurred.
Although applying more than 23 kg P2O5 ha-1 did not increase grain yield, the control treatment (0 kg P2O5 ha-1) produced a significantly lower yield, confirming that complete omission of phosphorus reduced the food barley productivity. Therefore, applying 23 kg P2O5 ha-1 is recommended because it provides sufficient phosphorus to maximise yield while reducing fertiliser costs. In addition, maintaining this level of phosphorus application helps sustain soil fertility and supports the long-term productivity of the farming system (Cook and Davis 1957; Beegle 2011).
6 Conclusion
Increased N application had highly significantly increased plant height, spike length, above ground dry biomass and grain yield of food barley, but not on thousand seed weight. However, there were no significant influences in all measured parameters among applied P2O5 (23, 46, and 69 kg ha-1) rates, and their interaction with N (23, 46, 69, 92 and 115 kg ha-1) rates, except a significant (\(p \leq 0.05\)) increased trend of above ground dry biomass has been shown with increased P rates. The significance of phosphorus fertilisation was evident at the 2020 experimental site, as the control treatment (0 kg P2O5 ha-1) produced a significantly lower grain yield than all phosphorus fertiliser application rates, demonstrating that phosphorus application was essential for improving food barley productivity in the study area. Therefore, it is recommended to apply the lowest P fertiliser rate (23 kg ha-1 P2O5) to enhance food barley productivity and maintain the availability of P in the soil. In addition, based on partial budget analysis, the application of 92 kg ha-1 N is the economically optimum fertiliser rate for food barley (Debark 1 variety) production in the Central and North Gondar highlands.
Artificial intelligence (AI) tools were used solely for grammatical correction and language improvement. The authors reviewed and verified all content and take full responsibility for the accuracy and integrity of the manuscript.
References
Publication Information
- Submitted: 08 June 2026
- Accepted: 03 July 2026
- Published (Online): 08 July 2026
Reviewer Information
Reviewer 1:
Dr.Sreelakshmi P
Assistant Professor
Joy University, TirunelveliReviewer 2:
Anonymous
The statements, opinions and data contained in all publications are solely those of the individual author(s) and contributor(s) and not of the publisher and/or the editor(s).
The publisher and/or the editor(s) disclaim responsibility for any injury to people or property resulting from any ideas, methods, instructions or products referred to in the content.
© Copyright (2025): Author(s). The licensee is the journal publisher. This is an Open Access article distributed under the terms of the Creative Commons Attribution-NonCommercial-NoDerivatives 4.0 International License, which permits non-commercial use, sharing, and reproduction in any medium, provided the original work is properly cited and no modifications or adaptations are made.
Footnotes
** = significant at \(p \leq 0.01\), * = significant at \(p \leq 0.05\), NS = not significant↩︎
** = significant at \(p \leq 0.01\), * = significant at \(p \leq 0.05\), NS = not significant↩︎
PH = plant height (cm), SPL= spike length (cm), BM = above ground dry biomass (kg ha-1), GY = grain yield (kg ha-1), TSW= thousand seed weight (g), ** = significant at \(p \leq 0.01\), * = significant at \(p \leq 0.05\), NS = not significant↩︎
N = N rate (kg ha-1), AGY = adjusted (10%) grain yield (kg ha-1, Straw= straw yield (kg ha-1), GB = gross benefit from grain and straw yield (ETB ha-1), TVC = total cost that vary (ETB ha-1), NB = net benefit (ETB ha-1), MB = marginal benefit, MC= marginal cost, MRR = marginal rate of return (%)↩︎