Optimization of Vermicompost Rates based on the Nitrogen and Phosphorus Requirements of Bread Wheat (Triticum aestivum L.) in Northwestern Amhara, Ethiopia
Declining soil fertility and dependence on inorganic fertilizers threaten sustainable wheat production in Ethiopia. A three-year field experiment at Adet Agricultural Research Center evaluated the effects of integrating vermicompost with NP fertilizer on bread wheat productivity, soil fertility, and economic returns in Northwestern Amhara. Read more …

Declining soil fertility and dependence on inorganic fertilizers threaten sustainable wheat production in Ethiopia. A three-year field experiment at Adet Agricultural Research Center evaluated the effects of integrating vermicompost (VC) with NP fertilizer on bread wheat productivity, soil fertility, and economic returns. The experiment used a randomized complete block design with five VC rates (0, 3, 6, 9, and 12 t ha-1) and three NP levels (0, 50%, and 100% of the recommended rate). The VC × NP interaction significantly affected biomass and grain yield. The highest biomass (6,859.6 kg ha-1) and grain yield (4,125.5 kg ha-1) were obtained with 9 t ha-1 VC plus 50% NP. Vermicompost also increased soil organic carbon. This treatment produced the highest net benefit (ETB 192,305.9 ha-1) and marginal rate of return (240.3%). Integrating VC with NP fertilizer enhanced wheat productivity, improved soil fertility, and increased economic returns under Ethiopian conditions.
Bread wheat, Nutrient management, Nitrogen and Phosphorous, Vermicompost
1 Introduction
Wheat (Triticum aestivum L.) is one of the most important cereal crops worldwide, providing nearly 20% of the calories and protein consumed by the global population and playing a central role in food and nutritional security (Gooding and Shewry 2022). In Ethiopia, wheat is one of the principal cereal crops and contributes approximately 14% of the total dietary energy intake, making it the second most important staple food after maize (Food and Agriculture Organization of the United Nations 2024). Wheat is widely used in the preparation of traditional Ethiopian foods and beverages and also serves as an essential raw material for the food-processing industry and the production of various wheat-based products (Tadesse et al. 2022; Ministry of Agriculture of Ethiopia 2024). Wheat production in Ethiopia is predominantly undertaken by smallholder farmers under rain-fed conditions and irrigation (Kedir 2022; Mohammed et al. 2024). Wheat cultivation supports approximately 4.8 million smallholder farmers, representing nearly one-third of the country’s grain-producing households, highlighting its critical contribution to rural livelihoods, agricultural development, and national food security (Muche and Tolossa 2022; Mohammed et al. 2024). Ethiopia is the largest wheat producer in Sub-Saharan Africa; however, considerable yield gaps still exist due to various factors, among which soil fertility constraints are a major cause (Belachew et al. 2022; Tadesse et al. 2022). As a result, the country’s average wheat yield remains below its potential (Erkossa et al. 2022; Agegnehu et al. 2016).
Continuous cultivation, nutrient mining, and soil erosion have contributed to declining soil fertility limiting sustainable wheat production in Ethiopia (Esubalew et al. 2023; Asmamaw et al. 2023). Nitrogen (N) and phosphorus (P) deficiencies are among the most widespread soil fertility constraints in Ethiopian agricultural soils and significantly limit wheat growth and productivity (Tesfaye et al. 2021; Abay et al. 2022). Consequently, mineral fertilizers containing nitrogen and phosphorus have long been applied to increase wheat productivity (T. Abera et al. 2020). Recent studies therefore recommend an integrated nutrient management strategy that combine inorganic fertilizers with organic nutrient sources to improve nutrient use efficiency, enhance soil organic carbon, stimulate soil biological activity, and sustain crop productivity over the long term (Desta et al. 2023; Laekemariam and Gifole 2024). Organic fertilizers are important sources of soil organic matter (SOM) and essential plant nutrients, contributing to improved soil fertility, nutrient cycling, and sustainable crop production (Lal 2022). Among these organic nutrient sources, vermicompost is a nutrient-rich organic fertilizer produced through the biodegradation of organic materials by earthworms, most commonly Eisenia fetida (red wiggler), in association with diverse microorganisms (Lim et al. 2022). A wide range of biodegradable organic materials, including crop residues, animal manures, household organic waste, can be used as feedstock for vermicomposting (Suthar 2022; Singh et al. 2023).
However, vermicompost production in smallholder farming systems is often insufficient to meet the full nutrient requirements of cereal crops due to limited organic feedstocks and labor availability (Mekonnen et al. 2023). Therefore, combining organic and inorganic nutrient sources can provide a balanced and sustained nutrient supply (Agegnehu et al. 2017). This approach can improve fertilizer use efficiency, soil properties, nutrient balance, and the long-term sustainability of agricultural systems (Vanlauwe et al. 2010; Gram et al. 2020). Accordingly, this study evaluated different rates and residual effects of vermicompost combined with NP fertilizer on bread wheat (Triticum aestivum L.) yield, yield components, and soil chemical properties.
2 Materials and methods
2.1 Description of study area
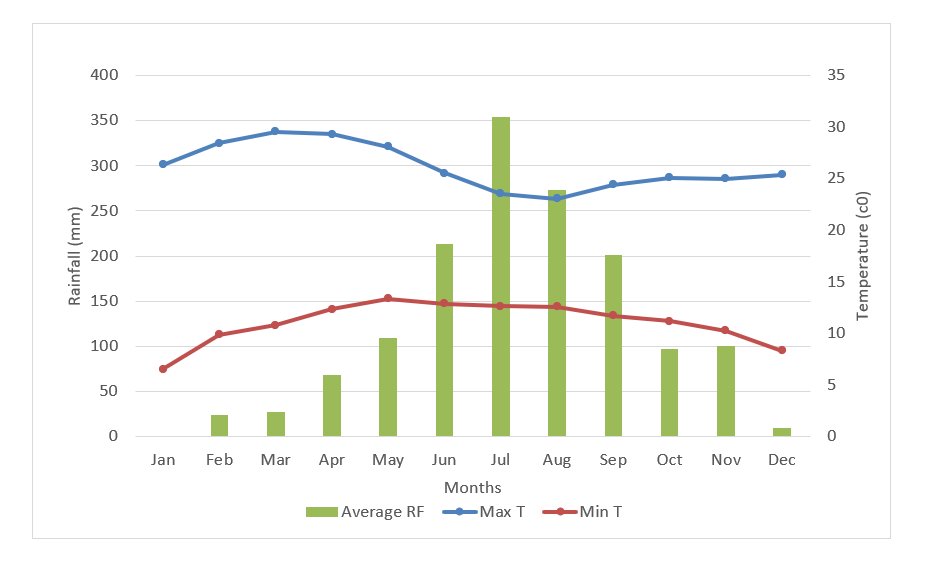
The study was conducted over three consecutive main cropping seasons (2017-2019) representing by Y1, Y2 and Y3 at the Adet agricultural research center main station in western Amhara, Ethiopia. The area is characterized by a mixed farming system, in which crop production and livestock rearing are the dominant agricultural activities. Wheat, tef, and maize are the major crops grown in the area. The soil at the experimental site is classified as a Nitisol according to the International Union of Soil Sciences (International Union of Soil Sciences 2022). The research center is located at 11°17′ N latitude and 37°43′ E longitude, at an altitude of 2,240 m above sea level. The study area receives an average annual rainfall of approximately 1,477 mm and has a mean annual maximum temperature of 26°C and a mean annual minimum temperature of 11°C (Figure 1).
2.2 Experimental setup
The treatments consisted of factorial combinations of five vermicompost (VC) rates (0, 3, 6, 9, and 12 tha-1) and three levels of recommended inorganic fertilizers: 0%, 50%, 100% of the recommended rate (92 kg Nha-1 and 46 kg P2O5ha-1). The experiment was laid out in a randomized complete block design (RCBD) with three replications.
The vermicompost was produced using the earthworm Eisenia fetida with cow manure, faba bean residue, maize stover, and wheat straw as the main feedstocks. This species is widely used in vermicomposting because of its ability to efficiently process organic materials and its high reproductive capacity. Urea (CO(NH2)2) contains 46% nitrogen (N) and triple superphosphate (TSP; Ca(H2PO4)2·H2O) were used as sources of nitrogen (N) and phosphorus (P), respectively.
The gross plot size was 3 m × 3 m (9 m²), while the net plot size was 2.6 m × 3 m (7.8 m²). The spacing between adjacent plots was 1.0 m, and the spacing between blocks was 1.5 m. The bread wheat variety TAY, released by the Adet Agricultural Research Center (Adet ARC) in 2005 (Adet Agricultural Research Center (ADARC) 2005), was used as the test crop because of its good adaptation and high yield potential in the study area. It was sown in rows spaced 20 cm apart at a seed rate of 150 kg ha-1. The entire recommended dose of phosphorus was applied at planting, whereas nitrogen was applied in two equal splits: half at sowing and the remaining half as a side dressing at the tillering stage. Vermicompost was applied only once at the establishment of the experiment according to the respective treatment rates and was uniformly incorporated into the soil before planting. The experimental plots were maintained as permanent plots throughout the study to evaluate the residual effects of vermicompost over successive cropping seasons.
2.3 Data collection and analysis
2.3.1 Soil, vermicompost sampling
Prior to planting and before the application of vermicompost, composite soil samples were collected from the experimental site using a soil auger at a depth of 0-20 cm. A representative vermicompost sample was also collected from the prepared vermicompost for laboratory analysis. At crop harvest, soil samples were collected separately from each treatment plot and analyzed independently.
The soil and vermicompost (VC) samples were air-dried under shade, gently crushed using a mortar and pestle, and passed through a 2-mm sieve for the analysis of most chemical properties. For the determination of organic carbon (OC) and total nitrogen (TN), a portion of each sample was further ground and passed through a 0.5-mm sieve. Soil pH was measured using a glass electrode pH meter in a 1:2.5 soil-to-water suspension, whereas the pH of the vermicompost was determined in a 1:5 vermicompost-to-water suspension following the procedure described by (Estefan et al. 2013). Available phosphorus in soil and vermicompost samples was determined using the Olsen sodium bicarbonate extraction method (Olsen and Sommers 1982). Although the Olsen method was originally developed for neutral to alkaline soils, the 0.5 M sodium bicarbonate extractant at pH 8.5 promotes the release of phosphate associated with Fe- and Al-bearing mineral surfaces, thereby extracting a fraction of the relatively labile soil phosphorus. Organic carbon (OC) was determined using the Walkley and Black wet oxidation method (Reeuwijk 1992), while total nitrogen (TN) was analyzed using the Kjeldahl method (Bremner and Mulvaney 1982).
2.3.2 Agronomic data and analysis
Agronomic data were collected following the standard procedures described by (D. Abera et al. 2020). Aboveground dry biomass yield was determined by harvesting plants at ground level. After threshing, grain yield was measured for each respective treatment. All collected data were subjected to analysis of variance (ANOVA) using R statistical software. Treatment means were separated using the Least Significant Difference (LSD) test at the 5% level of significance (\(p \leq 0.05\)).
2.3.3 Economic analysis
A partial budget analysis was conducted following the procedures described by CIMMYT (CIMMYT 1988). The mean grain yield of bread wheat obtained from each treatment over the three experimental years (2017-2019) was used for the analysis. To account for the yield gap that may arise between research-managed experimental plots and farmers’ field conditions, both grain and straw yields were adjusted downward by 10%, as recommended by CIMMYT (CIMMYT 1988). The average current prices of the inputs and outputs required for the partial budget analysis were obtained from local market surveys and other relevant sources. The field price of bread wheat grain in 2026 was 65 Ethiopian Birr (ETB) kg-1 and straw yield was 1 kg 6 birr. The current prices of fertilizers were 101 ETB kg-1 for urea (46% N) and 95 ETB kg-1 for phosphorus (P2O5), calculated based on the prevailing market price of DAP fertilizer. VC current price was 1kg 6 ETB. These prices were used to estimate the variable costs and gross returns for each treatment.
3 Results
3.1 Effect of NP fertilizer and vermicompost on wheat yield
The main and interaction effects of vermicompost (VC) and NP fertilizer on the aboveground biomass and grain yield of bread wheat across all experimental years are presented in Tables 1 and 2. The results showed that the integrated application of vermicompost and NP fertilizer had very highly significant (\(p \leq 0.001\)), highly significant (\(p \leq 0.01\)), and significant (\(p \leq 0.05\)) effects on aboveground biomass and grain yield across the experimental years, except for aboveground biomass in Y3, where the interaction effect was not significant (Table 2). The main effect of NP fertilizer on aboveground biomass and grain yield showed an increasing trend as the NP rate increased from 0 to 100% of the recommended rate (Table 1). All NP fertilizers rates produced significantly higher above ground biomass and grain yield of wheat than the control (Table 1). Similarly, the main effect of vermicompost increased both aboveground biomass and grain yield with increasing application rates up to 9 t ha-1, after which both parameters declined at 12 t ha-1 (Table 1).
The over-year mean results indicated that the application of 9 t ha-1 vermicompost combined with 50% NP fertilizer produced the highest aboveground biomass (6,859.6 kg ha-1) and grain yield (4,125.5 kg ha-1) (Table 2). The second-highest grain yield (3,564.3 kg ha-1) was obtained from the combined application of 6 t ha-1 vermicompost and 100% of the recommended NP fertilizer rate, while the second-highest aboveground biomass (5,621.1 kg ha-1) was obtained from the application of 9 t ha-1 vermicompost combined with 100% NP fertilizer (Table 2). In contrast, the lowest aboveground biomass (1,823.3 kg ha-1) and grain yield (591.0 kg ha-1) were recorded in the control treatment (Table 2).
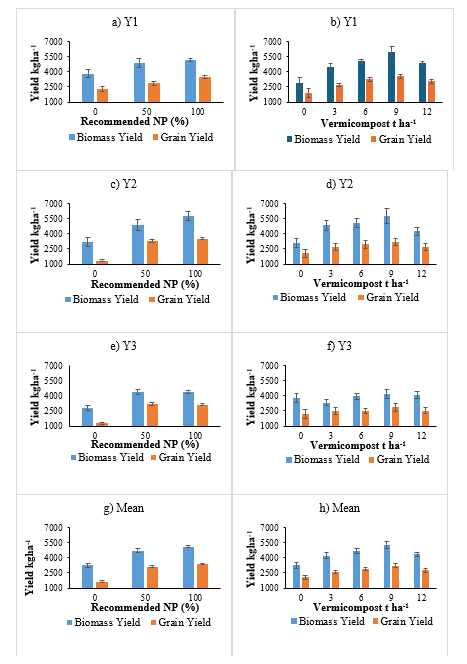
The residual effect of NP fertilizer did not result in a substantial increase in aboveground biomass or grain yield from year 1 to year 3 (Figure 2). In contrast, the residual effect of vermicompost became more pronounced over time, with all vermicompost treatments applied without NP fertilizer producing higher aboveground biomass and grain yield than the control (0 t ha-1 VC). These responses exhibited an increasing trend across the three years, demonstrating the cumulative residual benefits of vermicompost (Figure 2). Based on the mean values across years, the main effect of vermicompost indicated that applications of 3, 6, 9, and 12 t ha-1 VC in the absence of NP fertilizer increased aboveground biomass and grain yield compared with the non-vermicompost treatment (0 t ha-1 VC) (Figure 2). Overall, the multi-year mean results showed that the application of 3 t ha-1 vermicompost in the absence of NP fertilizer increased aboveground biomass and grain yield by 62.4% and 168.5%, respectively, compared with the treatment without vermicompost (0 t ha-1 VC) (Table 2). Likewise, the application of 6 t ha-1 vermicompost alone increased aboveground biomass and grain yield by 166.5% and 220.9%, respectively, over the control (Table 2). Similarly, the application of 9 t ha-1 vermicompost alone resulted in 90.8% higher aboveground biomass and 268% higher grain yield than the control (Table 2). However, the application of 12 t ha-1 vermicompost recorded lower aboveground biomass and grain yield than the other vermicompost rates, with increases of 77.3% and 219.3%, respectively, compared with the control (Table 2).
| Treatment | Y1 | Y2 | Y3 | Mean | ||||
|---|---|---|---|---|---|---|---|---|
| ABM | GY | ABM | GY | ABM | GY | ABM | GY | |
| NP (%) | ||||||||
| 0 | 3836.1\(^{b}\) | 2278.2\(^{c}\) | 3191.7\(^{c}\) | 1344.7\(^{c}\) | 2785.5\(^{b}\) | 1259.1\(^{b}\) | 3271.1\(^{c}\) | 1627.3\(^{c}\) |
| 50 | 4929.5\(^{a}\) | 2872.2\(^{b}\) | 4874.1\(^{b}\) | 3275.4\(^{b}\) | 4389.5\(^{a}\) | 3187.0\(^{a}\) | 4731.0\(^{b}\) | 3111.5\(^{b}\) |
| 100 | 5230.9\(^{a}\) | 3513.2\(^{a}\) | 5739.7\(^{a}\) | 3540.1\(^{a}\) | 4436.5\(^{a}\) | 3114.7\(^{a}\) | 5135.7\(^{a}\) | 3389.3\(^{a}\) |
| SE(m) | 132.6 | 83.7 | 208.1 | 64.9 | 193.3 | 64.1 | 248.7 | 122.5 |
| LSD (5%) | 384.2*** | 242.6*** | 602.9*** | 188.2*** | 559.9*** | 185.8*** | 402.1*** | 198.0*** |
| VC (t ha\(^{-1}\)) | ||||||||
| 0 | 2894.8\(^{d}\) | 1893.9\(^{d}\) | 3092.9\(^{d}\) | 2057.2\(^{d}\) | 3783.8 | 2203.9\(^{c}\) | 3257.1\(^{c}\) | 2051.6\(^{d}\) |
| 3 | 4510.1\(^{c}\) | 2668.4\(^{c}\) | 4853.4\(^{bc}\) | 2663.3\(^{c}\) | 3336.0 | 2512.3\(^{b}\) | 4233.2\(^{b}\) | 2614.6\(^{c}\) |
| 6 | 5074.4\(^{b}\) | 3267.6\(^{ab}\) | 5053.2\(^{ab}\) | 2970.9\(^{b}\) | 3961.3 | 2514.6\(^{b}\) | 4696.3\(^{b}\) | 2917.6\(^{b}\) |
| 9 | 6000.1\(^{a}\) | 3559.2\(^{a}\) | 5761.0\(^{a}\) | 3219.9\(^{a}\) | 4199.8 | 2860.9\(^{a}\) | 5320.3\(^{a}\) | 3213.3\(^{a}\) |
| 12 | 4848.0\(^{bc}\) | 3050.2\(^{b}\) | 4248.6\(^{c}\) | 2688.9\(^{c}\) | 4071.7 | 2509.7\(^{b}\) | 4389.4\(^{b}\) | 2749.6\(^{bc}\) |
| SE(m) | 171.2 | 108.1 | 268.6 | 83.8 | 249.5 | 82.8 | 158.1 | 321.1 |
| LSD (5%) | 496.0*** | 313.2*** | 778.3*** | 243.0*** | NS | 239.8*** | 519.1*** | 255.7*** |
| NP × VC | *** | ** | *** | ** | NS | *** | *** | *** |
| CV (%) | 11.0 | 11.2 | 17.5 | 9.2 | 19.3 | 9.8 | 21.9 | 17.5 |
| Treatment | Y1 | Y2 | Y3 | Mean | ||||
|---|---|---|---|---|---|---|---|---|
| ABM | GY | ABM | GY | ABM | GY | ABM | GY | |
| VC0, NP0 | 1134.4\(^{f}\) | 539.8\(^{h}\) | 1460.0\(^{i}\) | 656.6\(^{i}\) | 2875.4 | 576.6\(^{h}\) | 1823.3\(^{g}\) | 591.0\(^{f}\) |
| VC0, NP50% | 2830.0\(^{e}\) | 1714.2\(^{g}\) | 3463.7\(^{efgh}\) | 2233.1\(^{f}\) | 3481.1 | 2316.6\(^{f}\) | 3258.3\(^{f}\) | 2088.0\(^{d}\) |
| VC0, NP100% | 4720.0\(^{bcd}\) | 3427.3\(^{bc}\) | 4355.0\(^{cdef}\) | 3282.0\(^{de}\) | 4994.5 | 3718.3\(^{b}\) | 4689.8\(^{cd}\) | 3475.8\(^{b}\) |
| VC3, NP0 | 3472.9\(^{e}\) | 2270.9\(^{f}\) | 3239.5\(^{fgh}\) | 1300.0\(^{h}\) | 2168.3 | 1190.0\(^{g}\) | 2960.2\(^{f}\) | 1586.9\(^{e}\) |
| VC3, NP50% | 5017.3\(^{bcd}\) | 2554.9\(^{ef}\) | 4829.8\(^{cd}\) | 3133.3\(^{e}\) | 3747.8 | 2966.6\(^{cde}\) | 4531.6\(^{cd}\) | 2884.9\(^{c}\) |
| VC3, NP100% | 5040.0\(^{bcd}\) | 3179.2\(^{bcd}\) | 6490.8\(^{ab}\) | 3556.6\(^{bcd}\) | 4091.9 | 3380.3\(^{bc}\) | 5207.6\(^{bc}\) | 3372.0\(^{b}\) |
| VC6, NP0 | 5518.8\(^{bc}\) | 2666.6\(^{def}\) | 5611.6\(^{bc}\) | 1516.6\(^{gh}\) | 3447.8 | 1507.0\(^{g}\) | 4859.4\(^{bcd}\) | 1896.7\(^{de}\) |
| VC6, NP50% | 4385.6\(^{d}\) | 3063.8\(^{bcde}\) | 4129.3\(^{defg}\) | 3562.6\(^{bcd}\) | 4170.9 | 3249.0\(^{cd}\) | 4228.6\(^{de}\) | 3291.8\(^{bc}\) |
| VC6, NP100% | 5319.0\(^{bc}\) | 4072.0\(^{a}\) | 5419.0\(^{bcd}\) | 3833.3\(^{ab}\) | 4264.9 | 2787.6\(^{e}\) | 5001.0\(^{bcd}\) | 3564.3\(^{b}\) |
| VC9, NP0 | 4710.6\(^{bcd}\) | 3113.4\(^{bcd}\) | 2968.6\(^{gh}\) | 1811.5\(^{g}\) | 2760.6 | 1599.6\(^{g}\) | 3479.9\(^{ef}\) | 2174.9\(^{d}\) |
| VC9, NP50% | 7747.5\(^{a}\) | 4133.3\(^{a}\) | 7180.8\(^{a}\) | 4048.0\(^{a}\) | 5650.6 | 4195.3\(^{a}\) | 6859.6\(^{a}\) | 4125.5\(^{a}\) |
| VC9, NP100% | 5542.0\(^{b}\) | 3431.0\(^{bc}\) | 7133.3\(^{a}\) | 3800.0\(^{abc}\) | 4188.0 | 2787.6\(^{e}\) | 5621.1\(^{b}\) | 3339.5\(^{b}\) |
| VC12, NP0 | 4344.0\(^{d}\) | 2800.0\(^{def}\) | 2678.8\(^{hi}\) | 1438.4\(^{gh}\) | 2675.2 | 1422.3\(^{g}\) | 3232.7\(^{f}\) | 1886.9\(^{e}\) |
| VC12, NP50% | 4666.6\(^{cd}\) | 2894.3\(^{cde}\) | 4766.6\(^{cde}\) | 3400.0\(^{cde}\) | 4897.4 | 3207.2\(^{cd}\) | 4776.9\(^{bcd}\) | 3167.2\(^{bc}\) |
| VC12, NP100% | 5533.3\(^{b}\) | 3456.4\(^{b}\) | 5300.0\(^{bcd}\) | 3228.4\(^{de}\) | 4642.7 | 2899.3\(^{de}\) | 5158.6\(^{bc}\) | 3194.7\(^{b}\) |
| SE(m) | 296.6 | 187.2 | 465.3 | 145.3 | 432.2 | 143.4 | 556.1 | 273.9 |
| LSD (5%) | 859.2*** | 542.5*** | 1348.1*** | 420.9** | NS | 415.4*** | 899.2*** | 442.9*** |
| CV (%) | 11.0 | 11.2 | 17.5 | 9.2 | 19.3 | 9.8 | 21.9 | 17.5 |
3.2 Chemical properties of compost and soil
The organic carbon and total nitrogen contents of the vermicompost were 10.1% and 0.97%, respectively, resulting in a C:N ratio of approximately 10.5 (Table 3). This indicates that the vermicompost applied to the experimental field was well stabilized. The available phosphorus concentration was 12.6 ppm. The vermicompost had a pH of 7.8, which is considered favorable for the availability of most essential plant nutrients (Table 3).
| Parameters | Soil | Rating | Reference | VC | Rating | Reference |
|---|---|---|---|---|---|---|
| pH | 5.8 | Moderately acidic | (Tekalign et al. 1991) | 7.8 | Slightly alkaline | (Edwards et al. 2011) |
| Av. P | 4.1 | Very low | (Landon 1991) | 12.6 | N/A | - |
| TN | 0.13 | Low | (Tekalign et al. 1991) | 0.97 | N/A | - |
| OC | 1.4 | Low | (Hazelton and Murphy 2007) | 10.1 | N/A | - |
| C:N | 10.9 | Moderate | (Brady and Weil 2017) | 10.5 | Mature/Well stabilized | (Bernal et al. 2009) |
3.3 pH
The effects of vermicompost (VC) and NP fertilizer on soil pH are presented in Table 4. In year 1 (Y1), the highest soil pH was observed with the sole application of 6 t ha-1 VC and with the combined application of 12 t ha-1 VC + 100% NP (Table 4). In year 2 (Y2), the sole application of 12 t ha-1 VC and the control treatment recorded the highest soil pH (6.0). In year 3 (Y3), soil pH ranged from 5.5 to 5.7 across all treatments. Similarly, the over-year mean soil pH ranged from 5.7 to 5.9, with the lowest value recorded under the combined application of 12 t ha-1 VC + 100% NP (Table 4). The slightly alkaline nature of the vermicompost used in the experiment (pH 7.8; Table 3) increased soil pH, with the sole application of 12 t ha-1 vermicompost resulting in the highest soil pH in the second year, followed by a slight decline in the third year.
3.4 Total Nitrogen (TN)
The interaction effects of vermicompost (VC) and NP fertilizer on soil total nitrogen (TN) are presented in Table 4. The highest TN was recorded with the sole application of 6 t ha-1 VC in year 1 (0.16%) and with 6 t ha-1 VC combined with 50% NP in year 3 (0.17%). In year 2, all VC treatments, except the control, resulted in TN values ranging from 0.13 to 0.15%. Across the three years, soil total nitrogen (TN) did not differ significantly among vermicompost (VC) rates (Table 4). The lowest TN (0.11%) was recorded in the control treatment (Table 4).
3.5 Available Phosphorus (Av.P)
The interaction effect of vermicompost (VC) and NP fertilizer application on soil available phosphorus (Av.P) was not significant (Table 4). In year 1 (Y1), the highest soil available phosphorus concentration (6.1 ppm) was recorded from the application of 6 t ha-1 VC without NP fertilizer. In year 2 (Y2), the highest Av.P concentration (7.2 ppm) was observed in the control treatment, whereas in year 3 (Y3), the application of 12 t ha-1 VC combined with 100% NP fertilizer resulted in the highest Av.P concentration (7.5 ppm) (Table 4). However, considering the three-year mean, the highest soil available phosphorus was recorded from the sole application of 3 t ha-1 VC (Table 4).
3.6 Organic Carbon (OC)
The interaction effect of vermicompost (VC) and NP fertilizer on soil organic carbon (OC) was not significant (Table 4). The initial soil organic carbon content was 1.4% before treatment application (Table 3). Although the interaction effect was not significant, soil OC varied among treatments over the three years. In year 1, the highest OC content (1.82%) was recorded from the application of 9 t ha-1 VC combined with 50% NP. In year 2, the highest OC content (1.77%) was obtained from the sole application of 6 t ha-1 vermicompost, while in year 3 the highest OC content (2.09%) was recorded from the sole application of 6 t ha-1 VC. Across the three years, the highest mean OC content (1.81%) was also obtained from the sole application of 6 t ha-1 VC. The lowest OC contents (1.30% and 1.31%) were recorded in the control treatment in years 1 and 2, respectively. In year 3, the lowest OC content among the vermicompost-treated plots (1.75%) was recorded from the application of 12 t ha-1 VC combined with 50% NP, whereas the over-year mean OC content of the control treatment was 1.42%.
| Treatment | pH | TN | Av. P | OC | ||||||||||||
|---|---|---|---|---|---|---|---|---|---|---|---|---|---|---|---|---|
| Y1 | Y2 | Y3 | Mean | Y1 | Y2 | Y3 | Mean | Y1 | Y2 | Y3 | Mean | Y1 | Y2 | Y3 | Mean | |
| VC0, NP0 | 5.8 | 6.0 | 5.5 | 5.8 | 0.10 | 0.10 | 0.11 | 0.11 | 3.8 | 7.2 | 4.1 | 5.0 | 1.13 | 1.31 | 1.83 | 1.42 |
| VC0, NP50 | 5.9 | 5.9 | 5.7 | 5.8 | 0.14 | 0.15 | 0.11 | 0.14 | 3.8 | 5.4 | 6.0 | 4.7 | 1.29 | 1.35 | 1.80 | 1.48 |
| VC0, NP100 | 5.8 | 5.9 | 5.6 | 5.8 | 0.14 | 0.15 | 0.14 | 0.13 | 3.7 | 5.3 | 4.9 | 5.0 | 1.45 | 1.51 | 1.94 | 1.63 |
| VC3, NP0 | 5.9 | 6.0 | 5.6 | 5.8 | 0.14 | 0.15 | 0.15 | 0.15 | 3.7 | 4.2 | 3.0 | 3.6 | 1.72 | 1.40 | 1.96 | 1.69 |
| VC3, NP50 | 5.9 | 5.8 | 5.6 | 5.8 | 0.10 | 0.15 | 0.15 | 0.12 | 3.9 | 6.4 | 4.8 | 4.3 | 1.28 | 1.32 | 1.89 | 1.50 |
| VC3, NP100 | 5.9 | 5.9 | 5.6 | 5.8 | 0.10 | 0.15 | 0.12 | 0.13 | 3.7 | 5.1 | 4.2 | 5.0 | 1.39 | 1.65 | 1.83 | 1.62 |
| VC6, NP0 | 6.0 | 5.7 | 5.6 | 5.8 | 0.16 | 0.15 | 0.13 | 0.14 | 6.1 | 5.8 | 3.5 | 5.8 | 1.57 | 1.77 | 2.09 | 1.81 |
| VC6, NP50 | 5.9 | 5.9 | 5.7 | 5.8 | 0.12 | 0.15 | 0.17 | 0.15 | 4.0 | 6.3 | 4.3 | 4.9 | 1.41 | 1.48 | 1.87 | 1.59 |
| VC6, NP100 | 5.9 | 5.9 | 5.6 | 5.9 | 0.15 | 0.14 | 0.15 | 0.15 | 3.6 | 5.1 | 6.1 | 4.9 | 1.79 | 1.57 | 1.76 | 1.71 |
| VC9, NP0 | 5.8 | 5.9 | 5.6 | 5.8 | 0.31 | 0.15 | 0.15 | 0.15 | 4.2 | 6.1 | 4.2 | 4.8 | 1.76 | 1.62 | 1.94 | 1.77 |
| VC9, NP50 | 5.9 | 5.8 | 5.6 | 5.8 | 0.11 | 0.15 | 0.14 | 0.14 | 4.3 | 6.3 | 4.5 | 5.5 | 1.82 | 1.40 | 2.02 | 1.75 |
| VC9, NP100 | 5.9 | 5.7 | 5.7 | 5.8 | 0.14 | 0.13 | 0.15 | 0.13 | 3.4 | 6.2 | 7.0 | 5.0 | 1.44 | 1.60 | 2.00 | 1.68 |
| VC12, NP0 | 6.0 | 6.0 | 5.7 | 5.9 | 0.14 | 0.14 | 0.13 | 0.14 | 3.8 | 4.9 | 5.6 | 4.8 | 1.54 | 1.39 | 1.88 | 1.60 |
| VC12, NP50 | 5.9 | 5.8 | 5.7 | 5.8 | 0.13 | 0.14 | 0.13 | 0.15 | 3.9 | 5.4 | 4.8 | 6.0 | 1.32 | 1.39 | 1.75 | 1.49 |
| VC12, NP100 | 6.0 | 5.9 | 5.7 | 5.7 | 0.12 | 0.15 | 0.16 | 0.13 | 4.6 | 5.8 | 7.5 | 4.7 | 1.70 | 1.40 | 2.05 | 1.72 |
| SE(m) | 0.04 | 0.10 | 0.14 | 0.10 | 0.01 | 0.01 | 0.01 | 0.01 | 0.42 | 0.80 | 0.88 | 0.86 | 0.16 | 0.14 | 0.12 | 0.19 |
| LSD (5%) | NS | NS | NS | NS | NS | NS | NS | NS | NS | NS | NS | NS | NS | NS | NS | NS |
| CV (%) | 1.3 | 2.9 | 1.2 | 3.0 | 18.4 | 16.6 | 18.2 | 18.2 | 18.1 | 24.2 | 29.9 | 29.9 | 18.8 | 16.7 | 11.6 | 20.6 |
3.7 The Effects of vermicompost and NP fertilizer on economic feasibility of wheat production
Partial budget analysis of vermicompost (VC) combined with NP fertilizer treatments was conducted and presented in Table 5. The highest net benefit (ETB 192,305.9 ha-1) was obtained from the application of 9 t ha-1 VC combined with 50% NP fertilizer, with a marginal rate of return (MRR) of 240.3%. The second-highest net benefit (ETB 190,289.9 ha-1) was recorded from the sole application of 100% NP fertilizer, which resulted in an MRR of 730.8%. The control treatment generated the lowest net benefit (ETB 41,227.9 ha-1), whereas the lowest marginal rate of return (MRR; 240.3%) was recorded for the application of 9 t ha-1 vermicompost combined with 50% of the recommended NP fertilizer rate (Table 5).
The treatments involving 3,6 t ha-1 VC combined with all levels of NP fertilizer, 9 t ha-1 VC combined with 100% NP fertilizer, and 12 t ha-1 VC combined with all levels of NP fertilizer were dominated by other treatments and excluded from further economic analysis. Nevertheless, all treatments achieved MRR values exceeding the minimum acceptable threshold of 100%, indicating that each treatment was economically feasible (Table 5). Overall, the application of 9 t ha-1 VC combined with 50% NP fertilizer was the most economically profitable treatment, as it provided the highest net benefit.
| Treatment | GY | AGY | STY | ASTY | GBGY | GBSTY | TGB | TVC | NB | MRR |
|---|---|---|---|---|---|---|---|---|---|---|
| VC0NP0 | 591.0 | 531.9 | 1232.3 | 1109.1 | 34573.5 | 6654.4 | 41227.9 | 0 | 41227.9 | - |
| VC0NP50 | 2088.0 | 1879.2 | 1170.3 | 1053.3 | 122148.0 | 6319.6 | 128467.6 | 9800 | 118667.6 | 790.2 |
| VC0NP100 | 3475.8 | 3128.2 | 1214.0 | 1092.6 | 203334.3 | 6555.6 | 209889.9 | 19600 | 190289.9 | 730.8 |
| VC3NP0 | 1586.9 | 1428.2 | 1373.3 | 1236.0 | 92833.7 | 7415.8 | 100249.5 | 18000 | 82249.5 | D |
| VC3 NP50 | 2884.9 | 2596.4 | 1646.7 | 1482.0 | 168766.7 | 8892.2 | 177658.8 | 27800 | 149858.8 | D |
| VC3 NP100 | 3372.0 | 3034.8 | 1835.6 | 1652.0 | 197262.0 | 9912.2 | 207174.2 | 37600 | 169574.2 | D |
| VC6 NP0 | 1896.7 | 1707.0 | 2962.7 | 2666.4 | 110957.0 | 15998.6 | 126955.5 | 36000 | 90955.5 | D |
| VC6 NP50 | 3291.8 | 2962.6 | 936.8 | 843.1 | 192570.3 | 5058.7 | 197629.0 | 45800 | 151829.0 | D |
| VC6 NP100 | 3564.3 | 3207.9 | 1436.7 | 1293.0 | 208511.6 | 7758.2 | 216269.7 | 55600 | 160669.7 | D |
| VC9 NP0 | 2174.9 | 1957.4 | 1305.0 | 1174.5 | 127231.7 | 7047.0 | 134278.7 | 54000 | 80278.7 | D |
| VC9 NP50 | 4125.5 | 3713.0 | 2734.1 | 2460.7 | 241341.8 | 14764.1 | 256105.9 | 63800 | 192305.9 | 240.3 |
| VC9 NP100 | 3339.5 | 3005.6 | 2281.6 | 2053.4 | 195360.8 | 12320.6 | 207681.4 | 73600 | 134081.4 | D |
| VC12 NP0 | 1886.9 | 1698.2 | 1345.8 | 1211.2 | 110383.7 | 7267.3 | 117651.0 | 72000 | 45651.0 | D |
| VC12 NP50 | 3167.2 | 2850.5 | 1609.7 | 1448.7 | 185281.2 | 8692.4 | 193973.6 | 81800 | 112173.6 | D |
| VC12 NP100 | 3194.7 | 2875.2 | 1963.9 | 1767.5 | 186890.0 | 10605.1 | 197495.0 | 91600 | 105895.0 | D |
4 Discussion
The positive response of bread wheat grain and biomass yield to vermicompost application may be attributed to its ability to improve soil fertility through the gradual release of essential macro and micronutrients, increased soil organic matter, and stimulation of beneficial soil microorganisms. These improvements enhance nutrient availability and nutrient use efficiency, resulting in greater aboveground biomass production and grain yield. Similar observations have been reported by (Lazcano and Domínguez 2011; Rehman et al. 2023; Sande et al. 2024), who emphasized the role of vermicompost in improving soil quality and crop productivity. The main effect of vermicompost demonstrated an increasing trend in grain yield over the years, which may be attributed to the residual effect of vermicompost. As an organic fertilizer, vermicompost has the capacity to retain essential plant nutrients and release them gradually, thereby providing a sustained nutrient supply over successive cropping seasons. This observation is in agreement with the findings of Oyege and Bhaskar (Oyege and Bhaskar 2023) and (Ayamba et al. 2023), who reported that vermicompost improves nutrient retention and provides a sustained supply of nutrients for crop growth. The highest grain yield obtained from the combined application of 9 t ha-1 vermicompost and 50% of the recommended NP fertilizer rate indicates a synergistic interaction between organic and inorganic nutrient sources. The readily available nutrients supplied by mineral fertilizer, together with the continued nutrient release and soil-conditioning effects of vermicompost, likely enhanced nutrient uptake and improved fertilizer use efficiency, thereby promoting wheat growth and grain production. Comparable results have been reported by (Agegnehu et al. 2016; Mekonnen and Kitila 2024; Ejigu et al. 2025), who found that integrated nutrient management consistently outperformed the sole application of mineral fertilizers in terms of crop productivity and soil health. Similarly, (Blouin et al. 2019; Sande et al. 2024) reported that the beneficial effects of vermicompost (VC) on crop productivity are associated with improvements in soil physical structure, water-holding capacity, cation exchange capacity, and microbial activity, which collectively enhance crop growth and yield. According to Rehman et al. (2023) and Lim et al. (2016), vermicompost contains humic substances and biologically active compounds, including plant growth regulators such as auxins, gibberellins, and cytokinins, which stimulate root development, enhance nutrient absorption, and improve overall plant performance under diverse soil conditions.
The decline of soil pH in Y3 may be attributed to the gradual decomposition of the remaining organic matter, which can produce organic acids, together with the depletion of base cations through crop uptake and leaching, thereby slightly reducing soil pH. Similar findings were reported by Mulatu and Bayata (Mulatu and Bayata 2024), who noted that although vermicompost generally increases soil pH and improves soil fertility through the addition of exchangeable base cations, its liming effect may diminish over time as decomposition progresses and nutrients are removed by crops or lost through leaching. Since the changes in soil pH were small and the interaction effect of vermicompost and NP fertilizer was not statistically significant (\(p> 0.05\)), the observed differences are likely attributable to normal year-to-year variation.
Although the applied vermicompost contained 0.97% total nitrogen (Table 3), much of this nitrogen was gradually mineralized and subsequently taken up by wheat or lost through leaching, denitrification, volatilization, and erosion. Consequently, only a small proportion remained in the soil as residual total nitrogen. In addition, soil total nitrogen changes slowly because it represents a relatively large and stable nitrogen pool, making significant increases difficult to detect over a three-year period. Therefore, the residual effect of vermicompost on soil total nitrogen was limited. Similar findings were reported by Masto et al. (2006), who observed that although organic amendments improved several soil properties, changes in soil total nitrogen were relatively small over the experimental period because nitrogen is continuously transformed and removed through crop uptake and other loss pathways. The limited changes in soil total nitrogen (TN) during the short experimental period may be attributed to the continuous transformation of nitrogen through mineralization and immobilization processes, as well as its losses through and gaseous emissions (Diacono and Montemurro 2010; Breza and Grandy 2025). The relatively low C:N ratio (10.5; Table 3) indicates that the vermicompost was well decomposed and contained stabilized organic matter. As a result, nitrogen was released gradually through mineralization and was likely taken up by crops or lost through various pathways rather than accumulating as soil total nitrogen. Consequently, the residual effect of vermicompost on soil total nitrogen was limited. This result is in agreement with Lazicki et al. (2020), who reported that nitrogen release from stable organic amendments is generally slow and strongly influenced by amendment quality, including the C:N ratio. Similarly, Askari et al. (2020) reported that vermicompost undergoes gradual nitrogen mineralization due to its stabilized organic matter characteristics.
The relatively higher available phosphorus observed in the control treatment during Y2 may be attributed to temporal variations in soil phosphorus dynamics, including mineralization of native organic phosphorus, reduced phosphorus removal due to lower crop productivity, and fluctuations in soil P availability. Since the overall effects of VC and NP fertilizer on soil available phosphorus were not significant, this may represent short-term variation rather than a direct treatment response.
Although the interaction effect was not significant, the numerically higher Av.P value observed under 12 t ha-1 VC combined with 100% NP fertilizer in Y3 may be attributed to the cumulative addition of phosphorus from both vermicompost and mineral fertilizer. The applied vermicompost contained 12.6 ppm P (Table 3), which contributed additional phosphorus to the soil; however, the amount supplied may have been insufficient to cause a significant increase in soil available P. Moreover, phosphorus released from vermicompost is subjected to various soil processes, including adsorption by iron and aluminum oxides, precipitation under acidic soil conditions, microbial immobilization, and plant uptake. This is supported by the initial soil condition at the study site, where the available phosphorus content was low (4.1 ppm; Table 3). Since the soil was moderately acidic (pH 5.8), some of the released phosphorus may have been retained through interactions with Fe and Al oxides, limiting its accumulation in the available P pool. Therefore, only a fraction of the added phosphorus remained in the available P pool. This finding is consistent with Penn and Camberato (Penn and Camberato 2019), who reported that phosphate availability in acidic soils is controlled by phosphorus retention through adsorption and precipitation reactions with iron and aluminum minerals, reducing the proportion of applied phosphorus remaining in the soil solution. The higher three-year mean Av.P under the lower VC rate (3 t ha-1) may reflect the balance between phosphorus inputs, crop uptake, and soil P transformation processes. This finding is in line with Negassa and Leinweber (Negassa and Leinweber 2009), who reported that soil available phosphorus is influenced by the balance between phosphorus additions, plant uptake, and chemical processes regulating phosphorus retention and availability in soils. While higher VC rates supplied more phosphorus, they also enhanced crop growth and phosphorus demand, resulting in greater P removal from the soil. This finding is in agreement with Blouin et al. (2019), who reported that vermicompost application significantly improves plant growth and biomass production, thereby increasing plant nutrient uptake. Consequently, the observed differences in Av.P among VC rates were likely due to temporal fluctuations in phosphorus cycling rather than a consistent response to increasing vermicompost application. Similar findings were reported by Shen et al. (2011), who indicated that soil available phosphorus is highly dynamic and influenced by P addition, plant uptake, microbial immobilization, and transformation between different soil phosphorus pools.
The high organic carbon content (10.1%) of the vermicompost used in this study (Table 3) likely contributed to the increase in soil organic carbon. Although the highest OC content in year 1 was obtained with 9 t ha-1 vermicompost combined with 50% NP fertilizer, the sole application of 6 t ha-1 vermicompost consistently maintained the highest OC content in year 2, year 3, and across the three-year mean, suggesting a greater residual benefit of the moderate vermicompost rate. This result is consistent with the findings of Fernando and Arunakumara (2021) and Thirunavukkarasu et al. (2023), who reported that vermicompost, owing to its high organic carbon content, enriches soil organic matter and promotes the accumulation of soil organic carbon, thereby improving long-term soil fertility.
However, the lower soil organic carbon content observed at the highest vermicompost rate (12 t ha-1 combined with 50% NP) in year 3 compared with 6 t ha-1 vermicompost may be attributed to enhanced microbial decomposition and mineralization of organic matter under higher carbon inputs. The priming effect induced by higher vermicompost application rates may have stimulated microorganisms to utilize readily available carbon, increasing microbial activity and accelerating the decomposition of organic matter. Although this effect is generally more pronounced shortly after the addition of vermicompost or other organic amendments, continued mineralization of labile carbon fractions and the limited capacity of soils to stabilize additional carbon may reduce net carbon accumulation over time.
Similar mechanisms have been reported by Kuzyakov (2010) and Fontaine et al. (2007), who indicated that the addition of organic carbon inputs can stimulate microbial activity and accelerate the decomposition of native soil organic matter through priming effects, potentially reducing net soil carbon accumulation.
5 Conclusion
Integrated nutrient management through the combined use of organic amendments such as vermicompost (VC) and mineral fertilizers is an effective approach for improving soil fertility, nutrient availability, and crop productivity. In this study, the application of VC combined with NP fertilizer significantly influenced bread wheat biomass and grain yield across years, except for biomass in year 3. The highest over-year biomass (6,859.6 kg ha-1) and grain yield (4,125.5 kg ha-1) were obtained from 9 t ha-1 VC combined with 50% NP fertilizer, demonstrating the complementary effects of organic and inorganic nutrient sources. The residual effect of VC enhanced wheat productivity over time compared with the control. The interaction effects of VC and NP on soil organic carbon, total nitrogen, available phosphorus, and pH were not significant; however, VC application improved soil organic carbon, with the highest three-year mean recorded at 6 t ha-1 VC. Changes in soil nutrients and pH were limited due to nutrient uptake, fixation, mineralization, and temporal variations. Economic analysis revealed that 9 t ha-1 VC combined with 50% NP fertilizer was the most profitable treatment, providing the highest net benefit (ETB 192,305.9 ha-1) and marginal rate of return (240.3%). Overall, integrated VC and NP application improved wheat productivity, soil quality, and economic returns. Further research is required to evaluate the residual effects of vermicompost under single and repeated annual application strategies on the permanently maintained experimental site.
Artificial intelligence (AI) tools were used solely for grammatical correction and language improvement. The authors reviewed and verified all content and take full responsibility for the accuracy and integrity of the manuscript.
References
Publication Information
- Submitted: 17 July 2026
- Accepted: 17 August 2026
- Published (Online): 19 August 2026
Reviewer Information
Reviewer 1:
AnonymousReviewer 2:
Anonymous
The statements, opinions and data contained in all publications are solely those of the individual author(s) and contributor(s) and not of the publisher and/or the editor(s).
The publisher and/or the editor(s) disclaim responsibility for any injury to people or property resulting from any ideas, methods, instructions or products referred to in the content.
© Copyright (2026): Author(s). The licensee is the journal publisher. This is an Open Access article distributed under the terms of the Creative Commons Attribution-NonCommercial-NoDerivatives 4.0 International License, which permits non-commercial use, sharing, and reproduction in any medium, provided the original work is properly cited and no modifications or adaptations are made.
Footnotes
Where: ABM = Above ground biomass (kg/ha), GY = Grain yield (kg/ha), *** Very highly significant at \(p \leq 0.001\), ** highly significant at \(p \leq 0.01\), *significant at \(p \leq 0.05\), Means followed by the same letter within a column are not significantly different at \(p \leq 0.05\)↩︎
Where Av.P = Available phosphorus (ppm), TN = Total nitrogen (%), OC = Organic carbon (%), VC = Vermicompost, N/A = No standard rating exists for vermicompost nutrient concentrations↩︎
Where: Av.P = Available phosphorus (ppm), TN = Total nitrogen (%), OC = Organic carbon (%), Y1= year 1, Y2 = year 2 and Y3 = year 3↩︎
GY = Grain yield (kg/ha), AGY = Adjusted grain yield (kg/ha), STY = Straw yield (kg/ha), ASTY = Adjusted straw yield AGY (kg/ha), GBGY = Gross benefit of grain yield (kg/ha), GBSTY = Gross benefit of straw yield (kg/ha), TVC = Total variable costs (ETB), TGB = Total gross benefit (ETB), NB = Net benefit (ETB), MRR= Marginal rate of return (%), D = Dominated treatment, ETB = Ethiopian Birr↩︎