Improving Sesame (Sesamum indicum L.) Productivity through Optimised Nitrogen and Phosphorus Application in Northwestern Ethiopia
Nutrient management is a major challenge limiting sesame productivity in the lowland areas of Gondar. This study examined how nitrogen and phosphorus fertiliser rates influence sesame growth, yield, and economic returns in Metema, West Armachiho, and Tegedie, Northwestern Ethiopia. Read more …

Nutrient management is a major challenge limiting sesame productivity in the lowland areas of Gondar. This study examined how nitrogen (N) and phosphorus (P) fertilisers influence sesame growth and yield in Metema, West Armachiho, and Tegedie using a randomized complete block design with three replications. Five N rates (0, 46, 69, 92, 115 kg ha-1) and three P2O5 rates (0, 23, 46 kg ha-1) were applied, with P incorporated at sowing and N split between sowing and branching. Most growth and yield traits responded significantly to fertiliser application, except hundred seed weight. Both N and P2O5 had highly significant effects, and their interaction influenced branching, thousand seed weight, and grain yield. No three way interaction with location was observed. Although the maximum biological yield was achieved at the higher rate of 115 kg N and 46 kg P2O5 ha-1, economic analysis demonstrated that the application of 46 kg N and 23 kg P2O5 ha-1 provided the greatest net benefit and economic return across all districts. Overall, optimized rates of N and P nutrients are essential for improving sesame productivity, and the application of 46 kg N and 23 kg P2O5 ha-1 is recommended for sesame production in the lowland areas of North West Ethiopia and similar agro ecologies.
Sesame, Nitrogen, Phosphorus, Fertiliser, Soil fertility, Lowlands
1 Introduction
Agriculture remains the backbone of the Ethiopian economy, contributing approximately 36% to Gross Domestic Product (GDP), generating 83% of export earnings, and employing nearly 73% of the workforce (Muluye 2021). It also supports manufacturing and trade sectors. Sesame (Sesamum indicum), locally known as Selit, is the second largest foreign exchange earner among oilseeds. Oilseeds mainly sesame, soybean, and Niger seed, account for about 20% of agricultural export revenue, from which sesame contributing the most (Sirany and Tadele 2022). Sesame is widely grown in tropical and subtropical regions, including northwestern and southwestern Ethiopia such as Humera, Metema, Welkait, Wollega, Gambela and Benishangul Gumuz (Girmay 2018). It thrives in areas receiving 625–1100 mm rainfall and temperatures above 27°C. Although drought tolerant, sesame is sensitive to waterlogging, which reduces yield (Geremedhin 2024). Global sesame production reached 6.7 million tons in 2022, with Sudan, India, and Myanmar as leading producers (Haque et al. 2025). By 2024, global harvested area reached 13 million ha, with an average yield of 530 kg ha-1 (Afolabi et al. 2025; Alemu 2024). Ethiopia ranked ninth globally in 2019 with 262,654 tons, but productivity remains low (0.7 t ha-1), far below countries like China (>3.6 t ha-1) (Baraki et al. 2025).
Nitrogen and phosphorus remain the most limiting nutrients for sesame-producing lowlands of Ethiopia, as demonstrated by nutrient-response trials and fertilisation studies across Sudan-savannah and northern Ethiopian production systems (Baraki et al. 2025). Nitrogen is essential for amino acids, proteins, nucleic acids, enzymes, and canopy development. Phosphorus supports structural integrity, flowering, seed formation, maturity, and disease resistance. Field trials conducted in western Ethiopia showed significant yield increases with 150 kg ha-1 NPS fertiliser (Amare et al. 2019). In Bench Maji, mixed fertiliser (92 kg N, 90 kg P, 1.7 kg B, 17 kg S ha-1) produced the highest yield (Teshome et al. 2026). In western Tigray, the Aqua Crop model effectively predicted sesame response to N levels (Gebremedhin et al. 2023). Nitrogen is particularly important for oil and protein synthesis during seed development (Bellaloui et al. 2018).
Studies consistently show positive effects of N and P fertilisation on sesame growth and yield. Despite this potential, sesame productivity remains low (525 kg ha-1) in northern Ethiopia that is below the national average (787 kg ha-1) and far below yields in India, Cameroon and China (Sanni et al. 2026). Low productivity is attributed to lack of improved varieties, moisture stress, poor management, low soil fertility, and continuous mono-cropping (Teklu et al. 2021).
While prior studies have largely relied on single-location trials or generalized blanket recommendations, site-specific nutrient management strategies for sesame remain poorly defined across diverse agro-ecologies in northwestern Ethiopia. The fertilizer rates (0, 46, 69, 92, and 115 kg N ha-1; 0, 23, and 46 kg P2O5 ha-1) were chosen by expanding around the regional baseline of 46 kg N and 23 kg P2O5 ha-1. Zero controls established native soil capacity, nitrogen increments captured high-yield and loss thresholds for Setit-1, and phosphorus levels were set to capture fixation saturation without redundancy. This study addresses that gap by implementing a multi location N × P2O5 factorial experiment across Metema, West Armachiho, and Tegedie, thereby generating robust evidence on both agronomic and economic optima.
2 Materials and methods
2.1 Area of study
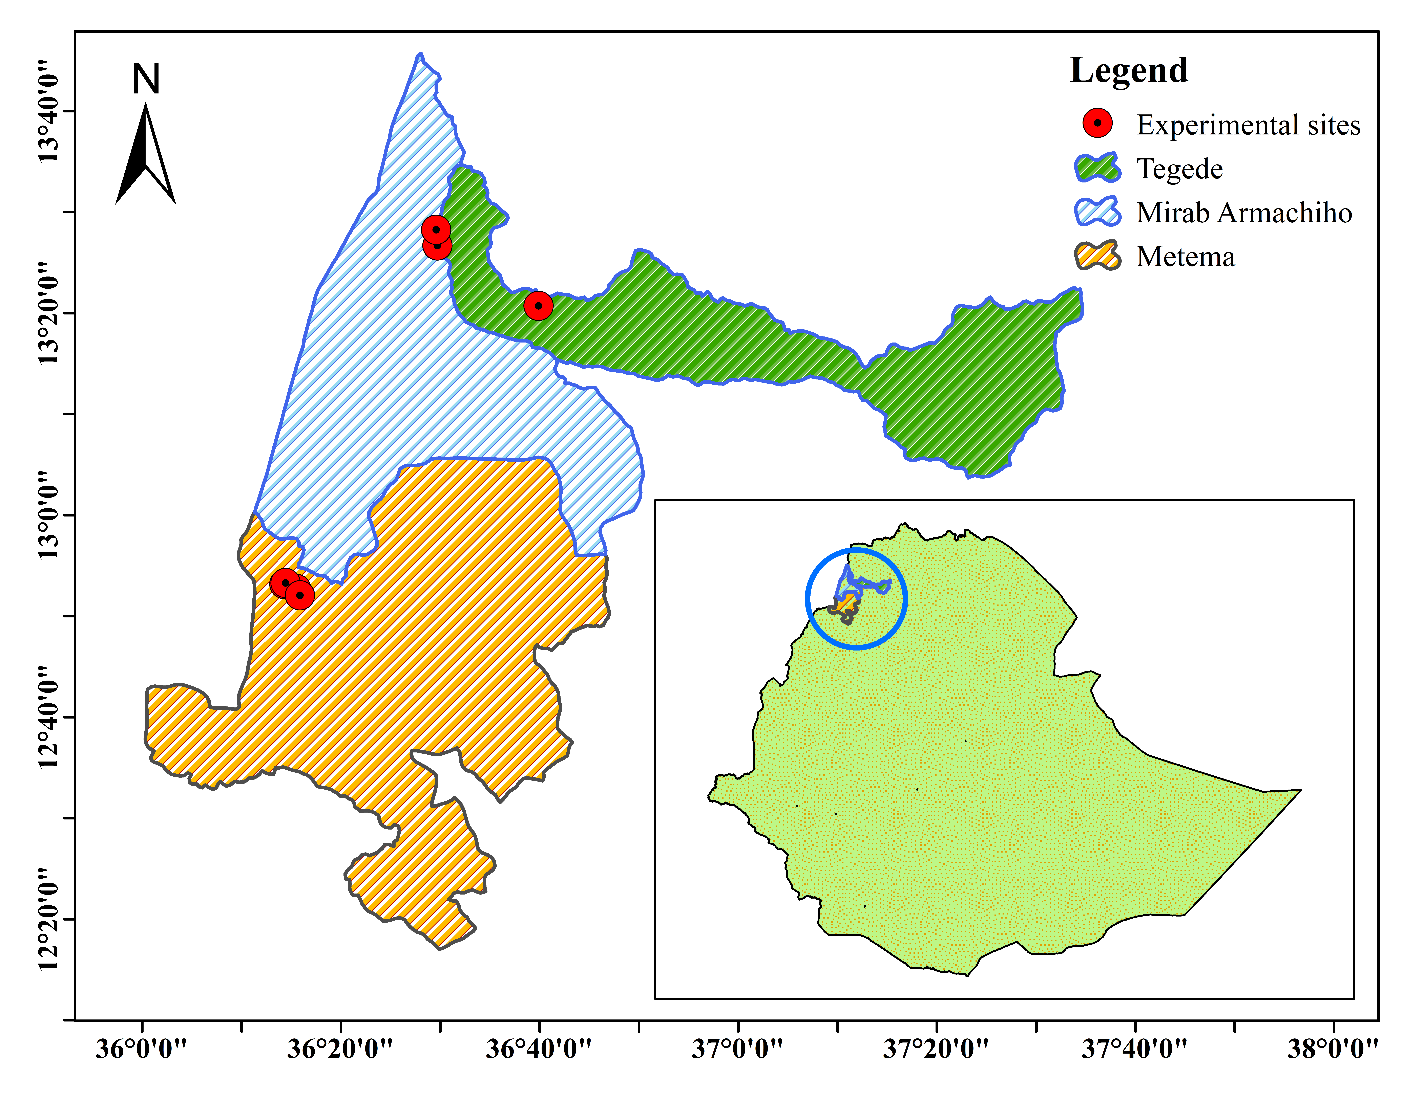
The study was conducted in the districts of Metema, Tegedie, and West Armachiho in the Amhara Region’s West and Central Gondar zones. These areas span elevations from 550 to 1608 masl and experience warm conditions, with temperatures ranging between 22 and 43°C. Annual rainfall averages 850-1100 mm, falling predominantly during the main rainy season from June to September.
2.2 Experimental sites, design, and procedures
The experiment was conducted across five distinct experimental sites located within three administrative districts (two sites in Metema, two sites in West Armachiho, and one site in Tegedie). The treatments comprised a factorial combination of five nitrogen (N) rates (0, 46, 69, 92, and 115 kg N ha-1) and three phosphorus rates (0, 23, and 46 kg ha-1), resulting in 15 treatment combinations using the Setit-1 variety with a seed rate of 4 kg ha-1. The experiment was laid out in a Randomized Complete Block Design (RCBD) with a factorial arrangement in three replications at each of the five sites, where the individual plot served as the experimental unit. The gross plot size was 3.0 m × 2.6 m (7.2 m2), with a distance of 1.5 m maintained between replications and 1.0 m between adjacent plots. Within each plot, the spacing between rows and individual plants was set at 40 cm and 10 cm, respectively. Nitrogen was applied in two equal splits as a basal application and at the branching stage using urea (46% N), while phosphorus was applied entirely at sowing using triple superphosphate (46% P2O5). Standard cultural practices, including manual weeding, were uniformly maintained across all plots.
2.3 Soil sampling and analysis
Composite soil samples (0–20 cm) were collected before sowing. A 1:2.5 soil and water suspension was used to measure the pH of the soil (Carter and Gregorich 2007). Organic carbon was determined using Walkley–Black method and then converted into organic matter dividing by 0.58. Total N was analysed using Kjeldahl digestion (Hailu and Betemariyam 2021). Exchangeable acidity was measured using KCl extraction (Dai and Richter 2000). Available P was determined using the Olsen method. Exchangeable bases (Ca, Mg, K, and Na) were extracted using ammonium acetate and measured via AAS and flame photometer (Motsara and Roy 2008). Cation exchange capacity (CEC) was determined using ammonium acetate at pH 7 (Chapman 1965).
Yield and yield-related traits were recorded following standard sesame descriptors. Plant height (PH, cm), number of branches per plant (NBPP), and number of pods per plant (NPPP) were measured from ten randomly selected plants in each net plot at harvest, and mean values were computed. Five pods from the same plants were used to determine the number of seeds per pod (NSPP) by dividing total grain count by pod number. Thousand-seed weight (TSW, g) was obtained by weighing 250 randomly selected seeds and multiplying by four. Grain yield (kg ha-1) was measured after threshing, adjusted to 10.5% moisture, and converted to a per-hectare basis.
2.4 Data analysis
Data collected from the five experimental sites were subjected to a combined analysis of variance (ANOVA) across locations using R software (version 4.3.2). In the statistical model, nitrogen (N), phosphorus (P2O5) levels, locations (sites) and blocks, along with their factorial interactions, were considered fixed factors. Prior to the combined ANOVA, tests for homogeneity of error variances were performed. Treatment means were separated using the Least Significant Difference (LSD) test at the 5% probability level.
Additionally, response curve and regression analyses were conducted using R software to evaluate the functional relationships and quantitative responses of sesame grain yield to varying levels of nitrogen and phosphorus fertilizers. Linear multiple regression model was fitted to determine optimal nutrient thresholds and economic yield responses.
ANOVA model was explained as follows:
\(G_{yijlk} = \mu + N_i + P_j + Loc_l + (N \times P)_{ij} + (N \times P \times Loc)_{ijl} + (N \times Loc)_{il} + (P \times Loc)_{jl} + B_k + e_{ijlk}\)
Where
\(G_{yijlk}\): represents the grain yield, \(\mu\): denotes the overall mean, \(N_i\): represents the role of nitrogen fertiliser, \(P_j\): captures the effects of phosphorus fertiliser, \(Loc_l\): considers the effect of location, \((N \times P)_{ij}\): represents the interaction effects of nitrogen and phosphorus, \((N \times P \times Loc)_{ijk}\): represents the interaction effects of nitrogen, phosphorus and location, \((P \times Loc)_{ijk}\): represents the interaction effects of phosphorus and location, \(B_k\): represents the block effect and \(E_{ijlk}\): represents the error associated with each level of the factors.
Regression analysis was also employed to determine the optimal N and P rates for sesame seed production. The following division was made of the regression equation: \(G_y = aN + bP + c\), where \(G_y\) is the predicted grain yield, c is the intercept and a and b are the coefficients for the N and P nutrients.
2.5 Partial budget analysis
After analysis of ANOVA, observed yield was used for economic analysis. The economic feasibility of the nutrients were evaluated using partial budget analysis, dominance analysis, and marginal rate of return (MRR) calculations. The mean grain yield was used for economic analysis, incorporating the average farm gate price of sesame grain yield and the cost of urea, and TSP fertilisers. Dominance Analysis: carried out as detailed by (CIMMYT 1988). This Analysis identified potentially profitable (not dominated) treatments versus less favorable (dominated) treatments. The lowest cost (farmer’s practice) to the highest cost treatment was classified. Marginal Rate Return (MRR) was calculated between pairs of not dominated treatments, MRR denotes the return per unit of investment in fertiliser as a percentage.
| Parameters | Metema | West-Armachiho | Tegedie |
|---|---|---|---|
| pH | 6.43–6.83 | 6.70–6.95 | 6.97 |
| Organic matter (%) | 1.043–1.643 | 1.093–1.756 | 1.135 |
| Total N (%) | 0.073–0.095 | 0.081–0.115 | 0.082 |
| Available P (ppm) | 1.861–5.489 | 1.267–1.802 | 4.656 |
| Ex. K⁺ cmol(+) kg-1 | 0.1536–0.2176 | 0.064–0.1408 | 0.2048 |
| CEC cmolc(+) kg-1 | 76.762–78.196 | 73.637–78.474 | 75.649 |
| Sand (%) | 10.72–14.72 | 14.72–16.72 | 10.72 |
| Clay (%) | 66.72–74.72 | 60.72–70.72 | 74.72 |
| Silt (%) | 10.56–22.56 | 14.56–22.56 | 14.56 |
| Textural class | heavy clay | heavy clay | heavy clay |
3 Results
3.1 Soil characteristics and interpretation
Based on the initial soil parameters of the Sesame NP trial sites and the ratings from (Hazelton and Murphy 2025) the following interpretations and recommendations can be made (Table 1). The pH in all sites is Neutral (6.43 to 6.95), which is suitable for Sesame, but may indicate potential deficiencies in the main nutrients, such as nitrogen and phosphorus. Soil organic matter is low, ranging from 1.043% to 1.756%. The total nitrogen content is also Medium (0.073% to 0.115%), providing a reasonable level for sesame growth. The available phosphorus varies significantly; all sites exhibit low levels (1.267 to 5.489 ppm), indicating a need for phosphorus supplementation at all sites. Exchangeable potassium is rated very low on most sites. The cation exchange capacity (CEC) is very high across all sites (73.637 to 78.474 cmol (+)/kg) which is advantageous for nutrient retention and availability. The soil textural class of the study area is generally heavy clay, which needs drainage management during heavy rain fall season. It may also affect the availability of nutrients and soil management practices. Therefore, targeted fertilisation strategies, particularly for nitrogen and phosphorus, were needed to optimise sesame yield.
3.2 Effects of N and PO on yield and yield parameters
ANOVA revealed that location had a highly significant effect (\(p<0.01\)) on all traits except thousand-seed weight. Both nitrogen (N) and phosphorus (P2O5) main effects were highly significant (\(p<0.01\)) across all parameters. The N×P interaction significantly influenced branches per plant, thousand-seed weight, and grain yield. The Location×N interaction was highly significant for branches per plant and thousand-seed weight, and significant (\(p<0.05\)) for grain yield, but not for plant height, pods per plant, or seeds per pod. The Location×P interaction significantly affected branches per plant and thousand-seed weight, while other traits were non-significant. The three-way Location×N×P interaction showed no significant effects on any parameter (Table 2).
| SOV | DoF | PH | NBPP | NPPP | NSPP | THSW | YIELD |
|---|---|---|---|---|---|---|---|
| Loc | 4 | 2894\(^{***}\) | 85.27\(^{***}\) | 2734\(^{***}\) | 253.7\(^{***}\) | 0.019\(^{NS}\) | 3375820\(^{***}\) |
| N | 4 | 4155\(^{***}\) | 41.11\(^{**}\) | 7051.3\(^{***}\) | 142.8\(^{***}\) | 1.23\(^{***}\) | 3079117\(^{***}\) |
| P2O5 | 2 | 678\(^{***}\) | 15.8\(^{**}\) | 3978.8\(^{***}\) | 198.6\(^{***}\) | 3.64\(^{***}\) | 1229514\(^{***}\) |
| N × P2O5 | 8 | 169\(^{NS}\) | 0.81\(^{***}\) | 200.7\(^{NS}\) | 88.4\(^{NS}\) | 0.041\(^{**}\) | 111063\(^{***}\) |
| Loc × N | 16 | 61\(^{NS}\) | 0.65\(^{***}\) | 46.5\(^{NS}\) | 20.7\(^{NS}\) | 0.051\(^{***}\) | 43280\(^{*}\) |
| Loc × P2O5 | 8 | 18\(^{NS}\) | 0.86\(^{***}\) | 88.6\(^{NS}\) | 11.78\(^{NS}\) | 0.071\(^{***}\) | 17453\(^{NS}\) |
| Loc × N × P2O5 | 32 | 31\(^{NS}\) | 0.1\(^{NS}\) | 70.5\(^{NS}\) | 10.18\(^{NS}\) | 0.012\(^{NS}\) | 10432\(^{NS}\) |
3.2.1 Plant height
Sesame plant height increased significantly with fertiliser application. Nitrogen raised height from 162.5 cm to 181.7 cm, with maximum growth at 115 kg/ha N. Phosphorus increased height from 172.2 cm to 175.9 cm at 46 kg/ha P2O5. The positive effects reflect the role of N and P in chlorophyll formation and plant development. These results agree with (Nadeem et al. 2015), who reported similar improvements in sesame growth and capsule production under higher N and P rates.
3.2.2 Seed number per pod
Nitrogen and phosphorus independently increased seed number per pod, while their interaction was not significant. The highest counts were observed at 69 kg N ha-1 (70.9 seeds) and 46 kg P2O5 ha-1 (71.3 seeds). These results confirm the critical role of both nutrients in pod development and align with (Akhtar et al. 2015), who reported similar improvements at moderate N and P levels.
3.2.3 Number of pods per plant
Nitrogen and phosphorus significantly increased pod number per plant. The highest count was 97.4 pods at 115 kg N ha-1, compared to 64.3 pods without N. Phosphorus also boosted pod formation, with 87.5 pods at 46 kg P2O5 ha-1 versus 75.4 pods without P. These results highlight the importance of adequate N and P supply, consistent with (Shehu et al. 2010).
| Treatment | PH | NSPP | NPPP | NBPP | THSW | Grain yield |
|---|---|---|---|---|---|---|
| Nitrogen | ||||||
| 0 | 162.5\(^{d}\) | 65.5\(^{c}\) | 64.3\(^{e}\) | 3.6\(^{d}\) | 2.6\(^{c}\) | 660\(^{d}\) |
| 46 | 171.5\(^{c}\) | 68.4\(^{bc}\) | 82.6\(^{c}\) | 5.2\(^{c}\) | 3\(^{b}\) | 1130.8\(^{c}\) |
| 69 | 176.6\(^{b}\) | 70.9\(^{a}\) | 76.4\(^{d}\) | 5.6\(^{b}\) | 3.04\(^{b}\) | 1219.6\(^{b}\) |
| 92 | 180.6\(^{a}\) | 70.28\(^{ab}\) | 90.5\(^{b}\) | 5.7\(^{b}\) | 3.1\(^{a}\) | 1275.2\(^{a}\) |
| 115 | 181.7\(^{a}\) | 70.8\(^{a}\) | 97.4\(^{a}\) | 6.1\(^{a}\) | 3.03\(^{b}\) | 1287.8\(^{a}\) |
| CD (5%) | 3.68 | 2.13 | 6.8 | 0.2 | 0.05 | 55.3 |
| Phosphorus | ||||||
| 0 | 172.2\(^{b}\) | 68.3\(^{b}\) | 75.4\(^{c}\) | 4.7\(^{c}\) | 2.7\(^{c}\) | 968.6\(^{b}\) |
| 23 | 175.6\(^{a}\) | 68.9\(^{b}\) | 80.4\(^{b}\) | 5.3\(^{b}\) | 3.07\(^{b}\) | 1168.2\(^{a}\) |
| 46 | 175.9\(^{a}\) | 71.3\(^{a}\) | 87.5\(^{a}\) | 5.7\(^{a}\) | 3.13\(^{a}\) | 1207.2\(^{a}\) |
| CD (5%) | 2.85 | 1.6 | 5.6 | 0.15 | 0.037 | 43.5 |
| Mean | 174.6 | 69.3 | 81.5 | 5.3 | 2.9 | 1114.7 |
| CV (%) | 3.17 | 7.38 | 11.5 | 9.12 | 3.94 | 11.82 |
| Treatment | West-Armachiho | Metema | Tegedie | Mean grain yield |
|---|---|---|---|---|
| Nitrogen | ||||
| 0 | 677.9\(^{c}\) | 778.4\(^{c}\) | 387.58\(^{c}\) | 614.6 |
| 46 | 1165.4\(^{b}\) | 1288.8\(^{b}\) | 745.61\(^{b}\) | 1066.6 |
| 69 | 1266.5\(^{a}\) | 1392.5\(^{a}\) | 780.01\(^{b}\) | 1146.3 |
| 92 | 1282\(^{a}\) | 1466.7\(^{a}\) | 878.54\(^{a}\) | 1209.1 |
| 115 | 1303.7\(^{a}\) | 1473.1\(^{a}\) | 885.43\(^{a}\) | 1220.7 |
| CD (5%) | 85.82 | 98.09 | 96 | 93.3 |
| Phosphorus | ||||
| 0 | 983.4\(^{b}\) | 1122.2\(^{b}\) | 631.65\(^{b}\) | 912.4 |
| 23 | 1196.8\(^{a}\) | 1333.8\(^{a}\) | 779.98\(^{a}\) | 1103.5 |
| 46 | 1237.1\(^{a}\) | 1383.7\(^{a}\) | 794.65\(^{a}\) | 1138.48 |
| CD (5%) | 66.47 | 75.97 | 74.36 | 72.3 |
| Mean | 1139.1 | 1279.9 | 735.43 | 1051.47 |
| CV (%) | 11.29 | 11.49 | 13.52 |
3.2.4 Number of branches per plant
The number of branches per plant was significantly impacted (\(p<0.01\)) by the combined main and interaction effects of N and P2O5 (Table 5). The plant development with the treatment of 115 kg N ha-1 by 46 kg P2O5 ha-1 had the greatest number of branches per plant (6.64). The plant that grew without N and P2O5 fertilisers had the fewest branches per plant (3.1) (Table 5).
3.2.5 Thousand seed weight
Thousand-seed weight was highly influenced by both nitrogen and phosphorus main and interaction effects (\(p<0.01\)). The maximum weight (3.3 g) occurred at 92 kg N ha-1 + 46 kg P2O5 ha-1, while the lowest (2.43 g) was recorded without fertiliser. Adequate N and P supply markedly improved seed weight compared to the control, consistent with (Akhtar et al. 2015), who reported higher seed weights under balanced N and P application.
3.2.6 Grain yield
Grain yield was highly influenced by the N×P interaction (\(p<0.01\)). The maximum yield (1358.6 kg ha-1) was obtained with 115 kg N + 46 kg P2O5 ha-1, while the control produced the lowest (592.4 kg ha-1). Yield increases were linked to more capsules per plant, higher seeds per capsule, and greater thousand-seed weight. These results agree with (Akhtar et al. 2015), who also reported higher yields under combined N and P fertilisation.
| Treatments | NBPP | THSW | Yield | ||||||
|---|---|---|---|---|---|---|---|---|---|
| P2O5 (kg ha-1) | \(\longrightarrow\) | ||||||||
| N (kg ha⁻¹) | 0 | 23 | 46 | 0 | 23 | 46 | 0 | 23 | 46 |
| 0 | 3.1\(^{h}\) | 3.6\(^{g}\) | 4.1\(^{f}\) | 2.43\(^{h}\) | 2.84\(^{e}\) | 2.82\(^{ef}\) | 592.4\(^{g}\) | 692.1\(^{f}\) | 744.2\(^{ef}\) |
| 46 | 4.4\(^{f}\) | 5.58\(^{d}\) | 5.78\(^{bcd}\) | 2.71\(^{g}\) | 3.13\(^{cd}\) | 3.18\(^{bcd}\) | 813.5\(^{e}\) | 1281.4\(^{abc}\) | 1297.5\(^{ab}\) |
| 69 | 5.1\(^{e}\) | 5.78\(^{bcd}\) | 5.9\(^{bcd}\) | 2.75\(^{fg}\) | 3.2\(^{bc}\) | 3.2\(^{ab}\) | 1088\(^{d}\) | 1278.3\(^{abc}\) | 1292.5\(^{ab}\) |
| 92 | 5.64\(^{cd}\) | 5.62\(^{cd}\) | 5.96\(^{bc}\) | 2.9\(^{e}\) | 3.16\(^{bcd}\) | 3.3\(^{a}\) | 1205.5\(^{bc}\) | 1276.7\(^{abc}\) | 1343.3\(^{a}\) |
| 115 | 5.56\(^{d}\) | 6.13\(^{b}\) | 6.64\(^{a}\) | 2.85\(^{e}\) | 3.1\(^{d}\) | 3.14\(^{cd}\) | 1192\(^{cd}\) | 1312.8\(^{a}\) | 1358.6\(^{a}\) |
| Mean | 5.27 | 2.98 | 1114.7 | ||||||
| CD (5%) | 0.35 | 0.09 | 105.5 | ||||||
| CV (%) | 9.11 | 3.93 | 11.82 |
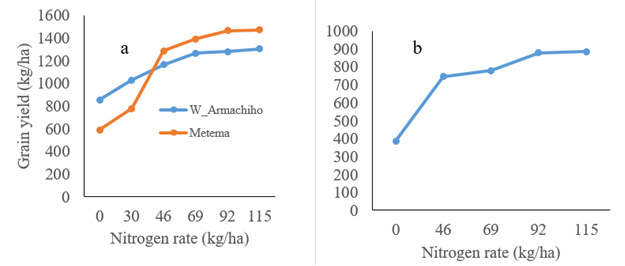
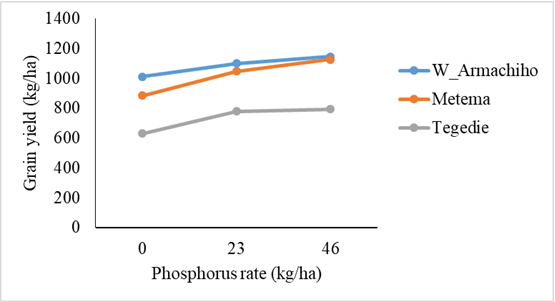
Nitrogen application positively influences grain yield, but excessive nitrogen beyond (92 kg ha-1)) may not provide substantial yield benefits. The response to nitrogen varies between locations, with Metema showing a greater initial increase. Optimal nitrogen application should consider economic and environmental aspects to avoid unnecessary fertiliser use (Figure 2) application of phosphorus fertiliser improves grain yield across all locations. The response is stronger at lower levels of phosphorus but diminishes at higher levels. Different locations respond differently, with West Armachiho performing the best and Tegedie the lowest. Optimal phosphorus application should be considered to maximise yield while avoiding excessive fertiliser use (Figure 3).
3.3 Regression analysis of N and PO fertiliser on sesame yields
The regression analysis of the effects of nitrogen and phosphorus on sesame yield in the study areas (West Armachiho, Tegedie and Metema) is summarized in (Figure 4).
The regression models for each location are as follows:
Metema: \(GY = 7.32N + 5.41P_2O_5 + 536.075\) with \(R^2 = 0.65\), Adjusted \(R^2 = 0.63\)
West Armachiho: \(GY = 3.7N + 3.6P_2O_5 + 827.1\) with \(R^2 = 0.68\), Adjusted \(R^2 = 0.65\)
Tegedie: \(GY = 4.4N + 3.5P_2O_5 + 374.6\) with \(R^2 = 0.77\), Adjusted \(R^2 = 0.74\)
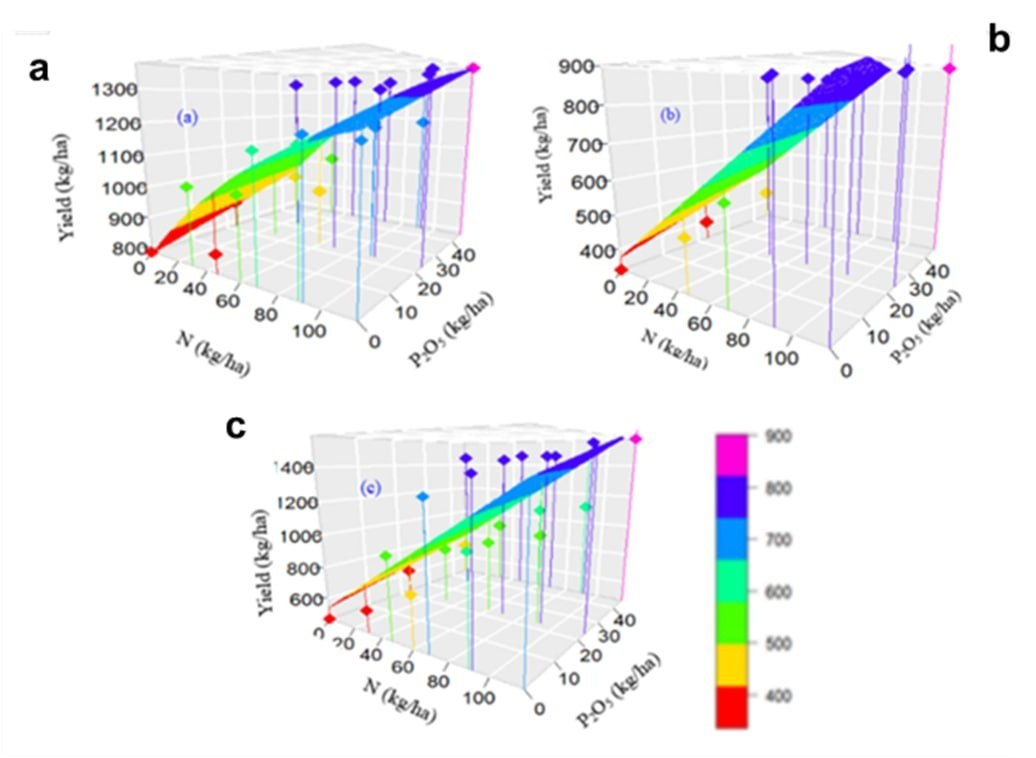
The regression analysis revealed that 65%, 68%, and 77% of the total variation of sesame grain yield in Metema, West Armachiho, and Tegedie was significantly explained by the regression equation.
The intercept, nitrogen and phosphorus levels all had highly significant effects (\(p<0.01\)) on grain yield at all sites. The sesame grain yield increased with increasing rates of N and P, with the highest yield (1571.1 kg ha-1) achieved at 115 kg N ha-1 and 46 kg P2O5 ha-1, indicated by the purple color in Figure 4. Under unfertilized circumstances, Metema had the lowest yield (780.8 kg ha-1), highlighting sesame’s heavy reliance on outside fertiliser inputs. Recent research continues to demonstrate that moderate fertilisation-roughly 112.5 kg N ha-1 and 45 kg P2O5 ha-1 optimises sesame yield, which is consistent with previous findings. At modest NP rates, (Amare et al. 2019) found significant increases in capsule quantity, seed weight, and overall yield, with diminishing results at higher fertiliser levels.
3.4 Partial budget analysis
The partial budget analysis indicated that, treatment with rate of 46 kg N and 23 kg P2O5 ha-1 had the highest net benefit of 169603 ETB, 161993 ETB, and 97013 ETB followed by 46 kg N and 46 kg P2O5 ha-1, with net benefits of 168244 ETB, 156844 ETB, and 93708 ETB in Metema, West Armachiho and Tegedie district respectively. The lowest net benefit (57834 ETB), (98378 ETB), (42336 ETB) was observed in the control (without fertiliser) treatment for respective districts. This analysis confirms that an increase in input applications may or may not be profitable for farmers, necessitating a careful economic evaluation.
| N (kgha-1) | P2O5 (kgha-1) | Gy (kgha-1) | Adj. Gy (kgha-1) | GB (birrha-1) | TVC (birrha-1) | NB (birrha-1) | D | MRR (%) |
|---|---|---|---|---|---|---|---|---|
| 0 | 0 | 459.1 | 413.1 | 57834 | 0 | 57834 | ||
| 0 | 23 | 614.9 | 553.4 | 77476 | 3375 | 74101 | 482 | |
| 0 | 46 | 695.7 | 626.1 | 87654 | 6750 | 80904 | 202 | |
| 46 | 0 | 950.1 | 855.1 | 119714 | 9750 | 109964 | 969 | |
| 46 | 23 | 1450.2 | 1305.2 | 182728 | 13125 | 169603 | 1767 | |
| 69 | 0 | 1274.7 | 1147.2 | 160608 | 14625 | 145983 | D | |
| 46 | 46 | 1466.2 | 1319.6 | 184744 | 16500 | 168244 | D | |
| 69 | 23 | 1438.9 | 1295.1 | 181314 | 18000 | 163314 | D | |
| 92 | 0 | 1386.1 | 1247.5 | 174650 | 19500 | 155150 | D | |
| 69 | 46 | 1463.8 | 1317.4 | 184436 | 21375 | 163061 | D | |
| 92 | 23 | 1458.2 | 1312.4 | 183736 | 22875 | 160861 | D | |
| 115 | 0 | 1359.4 | 1223.4 | 171276 | 24375 | 146901 | D | |
| 92 | 46 | 1545.7 | 1391.1 | 194758 | 26250 | 168508 | D | |
| 115 | 23 | 1488.9 | 1340.1 | 187614 | 27750 | 159864 | D | |
| 115 | 46 | 1571.1 | 1413.9 | 197951 | 31125 | 166826 | D |
| N (kgha-1) | P2O5 (kgha-1) | Gy (kgha-1) | Adj. Gy (kgha-1) | GB (birrha-1) | TVC (birrha-1) | NB (birrha-1) | D | MRR (%) |
|---|---|---|---|---|---|---|---|---|
| 0 | 0 | 781 | 702.7 | 98378 | 0 | 98378 | ||
| 0 | 23 | 871 | 783.8 | 109732 | 2125 | 107607 | 434 | |
| 0 | 46 | 917 | 825.2 | 115528 | 4250 | 111278 | 173 | |
| 46 | 0 | 840 | 755.7 | 105798 | 4750 | 101048 | D | |
| 46 | 23 | 1340 | 1206.2 | 168868 | 6875 | 161993 | 1932 | |
| 69 | 0 | 1147 | 1031.9 | 144466 | 7125 | 137341 | D | |
| 46 | 46 | 1316 | 1184.6 | 165844 | 9000 | 156844 | D | |
| 69 | 23 | 1321 | 1189.2 | 166488 | 9250 | 157238 | D | |
| 92 | 0 | 1193 | 1073.6 | 150304 | 9500 | 140804 | D | |
| 69 | 46 | 1332 | 1198.5 | 167790 | 11375 | 156415 | D | |
| 92 | 23 | 1297 | 1167.2 | 163408 | 11625 | 151783 | D | |
| 115 | 0 | 1187 | 1068.5 | 149590 | 11875 | 137715 | D | |
| 92 | 46 | 1356 | 1220.5 | 170870 | 13750 | 157120 | D | |
| 115 | 23 | 1350 | 1214.6 | 170044 | 14000 | 156044 | D | |
| 115 | 46 | 1374 | 1236.9 | 173166 | 16125 | 157041 | D |
| N (kgha-1) | P2O5 (kgha-1) | Gy (kgha-1) | Adj. Gy (kgha-1) | GB (birrha-1) | TVC (birrha-1) | NB (birrha-1) | D | MRR (%) |
|---|---|---|---|---|---|---|---|---|
| 0 | 0 | 336 | 302.4 | 42336 | 0 | 42336 | ||
| 0 | 23 | 394.9 | 355.4 | 49756 | 3375 | 46381 | 119.9 | |
| 0 | 46 | 431.9 | 388.7 | 54418 | 6750 | 47668 | 38.1 | |
| 46 | 0 | 488.1 | 439.3 | 61502 | 9750 | 51752 | 136.1 | |
| 46 | 23 | 874.1 | 786.7 | 110138 | 13125 | 97013 | 1341.1 | |
| 69 | 0 | 597.6 | 537.8 | 75292 | 14625 | 60667 | D | |
| 46 | 46 | 874.6 | 787.2 | 110208 | 16500 | 93708 | D | |
| 69 | 23 | 870.8 | 783.8 | 109732 | 18000 | 91732 | D | |
| 92 | 0 | 869.7 | 782.7 | 109578 | 19500 | 90078 | D | |
| 69 | 46 | 871.6 | 784.5 | 109830 | 21375 | 88455 | D | |
| 92 | 23 | 873.1 | 785.8 | 110012 | 22875 | 87137 | D | |
| 115 | 0 | 867 | 780.3 | 109242 | 24375 | 84867 | D | |
| 92 | 46 | 892.8 | 803.5 | 112490 | 26250 | 86240 | D | |
| 115 | 23 | 887 | 798.3 | 111762 | 27750 | 84012 | D | |
| 115 | 46 | 902.3 | 812 | 113680 | 31125 | 82555 | D |
4 Discussion
The initial soil characterization across the sesame trial sites showed neutral pH and very high CEC, indicating favorable chemical conditions for sesame production but also revealing clear fertility limitations due to low organic matter, low available phosphorus, and very low exchangeable potassium. These patterns are consistent with the soil rating guidelines of (Hazelton and Murphy 2025), who noted that neutral soils with low OM often exhibit nutrient deficiencies despite good nutrient-holding capacity. The strong location effects observed in this study reflect the inherent variability of sesame-growing environments in northwestern Ethiopia, aligning with findings by (Baraki et al. 2025). This environmental heterogeneity alters moisture availability and soil temperature regimes, directly modulating root interception and nutrient uptake efficiency across sites.
Nitrogen and phosphorus fertilisation significantly improved sesame growth and yield components. Plant height increased markedly with rising nitrogen and phosphorus rates, supporting earlier observations by (Nadeem et al. 2015), who documented similar improvements in sesame height and capsule formation under higher N and P fertilisation. Seed number per pod also responded positively to moderate N and P levels, consistent with the results of (Akhtar et al. 2015). From an agronomic standpoint, adequate phosphorus prevents early floral abortion and stimulates root proliferation, while optimal nitrogen sustains extended leaf area duration, ensuring that sufficient assimilates are translocated to developing reproductive sinks.
Pod production was strongly influenced by both nutrients, with peak numbers at upper fertiliser rates, agreeing with (Shehu et al. 2010). Higher nitrogen levels delay leaf senescence, prolonging the effective filling period, whereas phosphorus accelerates flowering and ensures uniform pod set. However, a distinct physiological trade-off emerged: while vegetative and absolute yield parameters peaked at the highest fertility levels (115 kg N ha-1 and 46 kg P2O5 ha-1), excessive nitrogen can sometimes induce vegetative overgrowth, increasing lodging susceptibility and mutual shading in narrow rows (40 cm × 10 cm).
The interaction effects of nitrogen and phosphorus were most pronounced for branching, thousand seed weight, and grain yield. The significant improvement in thousand seed weight under combined N × P application aligns with the findings of (Shehu et al. 2010), who reported synergistic nutrient effects on seed weight. Grain yield exhibited the strongest response to nutrient interaction, with the highest yield achieved under combined application of 115 kg N ha-1 and 46 kg P2O5 ha-1. This pattern corresponds with the synergistic yield increases reported by (Shehu et al. 2010), who also observed substantial yield gains under combined N and P fertilisation.
Economic analysis revealed that although higher rates maximised biological yield, the most profitable treatment was the moderate application of 46 kg N and 23 kg P2O5 ha-1. This economic optimum occurs because crop yield responses follow the law of diminishing returns, where the cost of incremental fertilizer inputs eventually outweighs the market value of the additional grain produced. This finding matches recent evaluations by (Baraki et al. 2025), emphasizing that smallholder profitability depends heavily on input-to-output price ratios. Ultimately, while maximum biological potential requires high external inputs, the updated recommendation of 46 kg N ha-1 + 23 kg P2O5 ha-1 represents the most agronomically sound and economically justified strategy for sustainable sesame production in the region.
5 Conclusion
The study demonstrated that sesame production is constrained by low soil fertility particularly low organic matter, phosphorus, and exchangeable potassium despite neutral pH and very high Cation Exchange Capacity. Nitrogen and phosphorus fertilisation significantly improves all major yield and yield components, with strong responses in plant height, pod formation, seed development, thousand-seed weight, and grain yield. Although the highest biological yield occurred at 115 kg N and 46 kg P2O5 ha-1, economic analysis showed that application of 46 kg N and 23 kg P2O5 ha-1 provided the greatest net benefit across locations. Overall, optimised rates of N and P nutrients is essential for improving sesame productivity. Therefore, the application of 46 kg N and 23 kg P2O5 ha-1 is recommended for sesame production in the lowland areas of North West Ethiopia.
Artificial intelligence (AI) tools were used solely for grammatical correction and language improvement. The authors reviewed and verified all content and take full responsibility for the accuracy and integrity of the manuscript.
References
Publication Information
- Submitted: 15 August 2026
- Accepted: 18 September 2026
- Published (Online): 20 September 2026
Reviewer Information
Reviewer 1:
Dr.Najiya Rinthas K
Assistant Professor
Kerala Agricultural UniversityReviewer 2:
Anonymous
The statements, opinions and data contained in all publications are solely those of the individual author(s) and contributor(s) and not of the publisher and/or the editor(s).
The publisher and/or the editor(s) disclaim responsibility for any injury to people or property resulting from any ideas, methods, instructions or products referred to in the content.
© Copyright (2025): Author(s). The licensee is the journal publisher. This is an Open Access article distributed under the terms of the Creative Commons Attribution-NonCommercial-NoDerivatives 4.0 International License, which permits non-commercial use, sharing, and reproduction in any medium, provided the original work is properly cited and no modifications or adaptations are made.
Footnotes
SOV - Source of Variation, DoF - Degree of Freedom, THSW - thousand seed weight, NBPP - number of branches per plant, NPPP - number of pods per plant, NSPP - number of seeds per pod, PH - plant height, and yield - yield per hectare; *** = \(p\)<0.001; ** = \(p\)<0.01; * = \(p\)<0.05; NS = not significant (\(p\)>0.05)↩︎
PH - plant height, NSPP - number of seeds per pod, NPPP - number of pods per plant, NBPP - number of branches per plant, THSW - weight of thousands of seeds↩︎
Means followed by the same letter within a column are not significantly different at \(p\)< 0.05 according to LSD. LSD (5%) and CV (%) are provided for each trait to indicate precision of comparison. Units are expressed as kgha-1 for fertilizer rates and yield↩︎
Adj. Gy: adjusted grain yield, Gy: grain yield, GB: gross benefit, MRR: marginal rate of return, NB: net benefit, and TVC: total variable cost↩︎
Adj. Gy: adjusted grain yield, Gy: grain yield, GB: gross benefit, MRR: marginal rate of return, NB: net benefit, and TVC: total variable cost↩︎
Adj. Gy: adjusted grain yield, Gy: grain yield, GB: gross benefit, MRR: marginal rate of return, NB: net benefit, and TVC: total variable cost↩︎