Linkage of Stakeholder Influence and Constraints on the Income Diversification of Coconut Farmers through Value Addition
Coconut value addition offers considerable scope for improving the income of coconut growers in Kerala. This study maps stakeholder interest and influence and ranks the constraints perceived by coconut growers in Thiruvananthapuram, Alappuzha and Kollam, proposing an actor-linked response framework. Read more …

Coconut value addition offers considerable scope for improving the income of coconut growers in Kerala. This study examined stakeholder interest and influence and prioritised the constraints perceived by coconut growers in the southern Kerala districts of Thiruvananthapuram, Alappuzha and Kollam. Data were collected from 90 farmers and 30 stakeholders, after which stakeholders were mapped through an interest–influence map, and farmer-perceived constraints were ranked using the Garrett ranking technique. Coconut processors and value-addition entrepreneurs formed the largest stakeholder group (23.33%). Government and coconut-development agencies recorded the highest influence (4.64) and were identified as key players. Labour shortage (Garrett score 80.48) and high labour cost (76.17) emerged as the most severe constraints. An actor-linked response framework is proposed to align constraints with stakeholder capacities. Government agencies and farmer organisations would lead labour mobilisation; research and extension institutions would provide technical assistance and skills training; and traders, processors and financial institutions would support market and infrastructure development. This framework provides a basis for coordinated interventions to strengthen coconut value addition.
Income diversification, Coconut value addition, Stakeholder analysis, Constraints of coconut growers, Interest–influence matrix, Garrett ranking technique
1 Introduction
Coconut is a significant crop in India, which contributes to the national economy as well as having importance in coastal states like Kerala. Coconut is traditionally referred to as Kalpavriksha, meaning the “tree of life” or the tree that provides the necessities of life. This description works well as almost every part of the coconut palm is useful, including the kernel, water, husk, shell, leaves and trunk (Coconut Development Board 2023).
In 2019, India was among the three largest coconut-producing countries globally, accounting for approximately 23 per cent of global production and 18 per cent of the area under coconut cultivation, after Indonesia and the Philippines (Commission for Agricultural Costs and Prices 2021). During 2024–25, India produced 20,301.22 million nuts from an area of approximately 2.195 million ha, recording a productivity of 9,249 nuts per hectare (Coconut Development Board 2026).
In the agrarian scenario of Kerala, coconut is a significant crop as it contributes to the rural economy. Coconut occupies the largest area among crops cultivated in Kerala. During 2024–25, it was cultivated over approximately 7.66 lakh ha, accounting for 30.44 per cent of the state’s total cropped area (Kerala State Planning Board 2026; Thamban et al. 2023). Coconut cultivation requires Kerala’s tropical climate and combined with its many uses and established market demand; it is an important resource in the state. However, farmers find it difficult to maintain a stable income from coconut cultivation due to a variety of reasons like fluctuation prices, pest and disease outbreaks, and effects of climate change.
There is considerable potential to improve farm income through coconut value addition but it still remains an underutilised area. Post harvest processing of raw nuts or other coconut by products leads to value addition which gets better returns and generates additional employment. Potential products include copra, coconut oil, desiccated coconut, virgin coconut oil, coconut milk and milk powder, coconut sugar, shell charcoal, activated carbon, coir products and coconut-based handicrafts (Coconut Development Board 2023). Nevertheless, an earlier national estimate indicated that hardly 2 per cent of India’s coconut production was utilised for value addition and industrial purposes, demonstrating the substantial unexploited potential of the sector (Muralidharan and Jayashree 2011).
The stakeholders across coconut value chain must employ a coordinated approach for successful coconut value addition. Farmers and their organisations supply and aggregate raw materials, while research and extension agencies provide technologies and technical guidance. Processors, financial institutions and marketing agencies support product development, investment and market access, whereas government agencies create an enabling policy and institutional environment. Effective collaboration among these stakeholders can overcome technological, financial and marketing constraints, strengthen product diversification and improve farmers’ share of value-chain benefits (Zainol et al. 2023; Thamban et al. 2023).
There are several constraints affecting coconut farmers in Kerala such as labour scarcity and high wages, fragmented landholdings, increasing cultivation costs, increased pest and disease incidence and limited adoption of improved technologies. Their income is further affected by price volatility, weak procurement mechanisms, limited awareness and production of value-added products, and the high costs associated with processing, storage, transportation and market promotion (George and Kuruvila 2022; Thamban et al. 2023).
Previous studies have largely examined stakeholders, constraints and technologies independently, with limited attention to linking stakeholder influence with the major challenges identified by farmers. Therefore, this study sought to identify key stakeholder groups and their roles in coconut value addition, assess their levels of interest and influence, prioritise the constraints experienced by coconut growers, and develop an actor-linked framework for implementing sustainable value-addition initiatives in southern Kerala.
2 Materials and methods
2.1 Study design and sampling
The study was conducted in southern Kerala. Thiruvananthapuram, Kollam and Alappuzha districts were purposively selected based on their comparatively larger areas under coconut cultivation, using the district-wise statistics for 2021–22 published in Farm Guide 2024 (Farm Information Bureau 2024). Information was collected from the respondents selected through a random sampling method, using an ex-post facto research design. Quantitative data collected through farmer interviews were complemented by stakeholder interviews, focus group discussions, expert consultation, field observation and secondary sources. Thirty coconut farmers were selected from each district, resulting in a total sample of 90. In addition, 30 individuals with relevant experience in coconut production, processing, marketing, finance, technology and institutional support were included in the stakeholder survey. Data were collected through personal interviews using a structured and pre-tested interview schedule. Before each interview, respondents were informed about the purpose of the study and assured that their participation was voluntary and the information collected would be used solely for academic purposes.
2.2 Measurement of income diversification
Income diversification was assessed using the Herfindahl–Hirschman Index (HHI), calculated from the shares of reported annual household income contributed by raw coconut production, coconut value-added products, farming other than coconut, allied enterprises and non-farm activities. The income-share approach follows its application to coconut-based livelihoods by Kalavathi et al. (2012).
\[ HHI = \sum_{i=1}^{n} P_i^2 \]
where HHI is the Herfindahl-Hirschman Index of the ith respondent, Pi is the proportion of total household income of the ith respondent contributed by the jth income source, and n is the number of income sources reported. The index ranges from values approaching zero to one. A lower value denotes a more diversified income portfolio, whereas a value approaching one denotes greater concentration or specialization in a single income source.
The respondents were classified according to the HHI ranges adapted from (Basantaray and Nancharaiah 2017). Respondents with an HHI value below 0.30 were classified as having a high extent of income diversification, those with values from 0.30 to 0.60 as having a medium extent of diversification, and those with values above 0.60 but below 1.00 as having a low extent of diversification. Respondents with an HHI value of exactly 1.00 were placed separately under no diversification or complete income specialisation.
2.3 Stakeholder interest and influence
Stakeholders were classified into seven functional groups according to their organisational affiliation and roles in coconut value addition. Their interest was measured using five indicators representing present involvement, expected benefits, organisational mandate, resource commitment and dependence on the development of coconut value addition. Influence was similarly assessed through five indicators relating to authority over policies and standards, control of essential resources, coordination ability, capacity to influence decisions and overall organisational strength. Each indicator was rated on a five-point scale. The researcher assigned interest and influence scores using the predefined indicator-specific scoring criteria, based on information obtained through stakeholder interviews. Mean interest and influence scores were first calculated for each respondent and subsequently averaged for the respective stakeholder group.
Mean scores were described using five equal-width bands: very low (1.00–1.80), low (>1.80–2.60), moderate (>2.60–3.40), high (>3.40–4.20) and very high (>4.20–5.00). These descriptive bands were distinct from the matrix threshold. The theoretical midpoint, 3.00, divided each axis: interest > 3.00 and influence >3.00 indicated key players; interest >3.00 and influence ≤ 3.00 indicated subjects; interest ≤3.00 and influence >3.00 indicated context setters; and scores ≤ 3.00 on both axes indicated crowd stakeholders. Continuous scores were retained when interpreting groups near the threshold.
2.4 Farmer constraint ranking
Constraints related to labour, marketing, agronomic practices, value addition, extension support and finance were identified through literature review, pilot study and stakeholder consultations. The constraints were ranked according to perceived severity. For rank \(R_{ij}\) assigned by respondent j to constraint i among \(N_j\) constraints, the percentage position was calculated as \(100(R_{ij} - 0.5)/N_j\). The assigned ranks were converted into scores using Garrett’s ranking technique (Garrett and Woodworth 1969). The mean score for each constraint was then calculated across all respondents, with a higher mean score representing a more severe constraint.
2.5 Interpretation and scope
The interest–influence matrix and Garrett rankings were jointly interpreted to identify suitable responses to the major challenges. The underlying causes and feasible interventions were verified using information collected from farmers, stakeholder interviews, focus group discussions and published literature. These are recommendations derived from descriptive evidence, not tested intervention effects. No inferential comparison between districts or estimate of income gain was reported.
3 Results
3.1 Farmer sample and value addition
The survey included 30 farmers in each district. The overall mean age was 48.09 years, and 65 of 90 respondents (72.22%) had a degree or postgraduate qualification. Mean operational landholding was 0.4623 acre. Overall, 72 respondents (80.00%) were in the reported Rs. 12,000–45,000 annual income from coconut value addition band, and the mean was Rs.28,516.67. Mean of 12.89 years of coconut value-addition experience was also observed (Table 1).
| Characteristic | Thiruvananthapuram | Kollam | Alappuzha | Overall |
|---|---|---|---|---|
| Age (years), mean ± SD | 49.47 ± 9.86 | 47.67 ± 12.53 | 47.13 ± 12.48 | 48.09 ± 11.60 |
| Degree or postgraduate, n (%) | 24 (80.00) | 20 (66.67) | 21 (70.00) | 65 (72.22) |
| Operational landholding (acre), mean ± SD | 0.4243 ± 0.2473 | 0.6243 ± 0.2138 | 0.3452 ± 0.2989 | 0.4623 ± 0.2788 |
| Annual income from coconut value addition (Rs.), mean ± SD | 28,750.00 ± 18,825.77 | 26,866.67 ± 14,715.07 | 29,933.33 ± 17,698.50 | 28,516.67 ± 17,021.05 |
| Reported value-addition experience (years), mean ± SD | 16.73 ± 12.84 | 10.93 ± 7.24 | 11.00 ± 6.44 | 12.89 ± 9.58 |
Among the 90 farmers, 87 were grouped with primary products (dehusked nuts, copra or traditionally processed oil), two with kernel-based products (desiccated coconut or coconut water), and one with tender-coconut products (Table 2).
| Product group | Farmers | % | Examples recorded |
|---|---|---|---|
| Primary coconut products | 87 | 96.67 | Dehusked nuts, copra, traditional coconut oil |
| Kernel-based products | 2 | 2.22 | Desiccated coconut, coconut water |
| Tender-coconut products | 1 | 1.11 | Tender coconuts, fresh tender-coconut water |
The mean HHI was 0.832 in Thiruvananthapuram, 0.877 in Kollam and 0.885 in Alappuzha (overall 0.865). Eighty-one farmers (90.00%) had low diversification, seven (7.78%) medium, one (1.11%) high and one (1.11%) had HHI = 1.00 (Table 3).
| HHI group | Thiruvananthapuram | Kollam | Alappuzha | Overall |
|---|---|---|---|---|
| No diversification (=1.00) | 0 | 0 | 1 | 1 (1.11%) |
| Low (>0.60 to <1.00) | 26 | 28 | 27 | 81 (90.00%) |
| Medium (0.30–0.60) | 3 | 2 | 2 | 7 (7.78%) |
| High (<0.30) | 1 | 0 | 0 | 1 (1.11%) |
| Mean HHI | 0.832 | 0.877 | 0.885 | 0.865 |
3.2 Stakeholder composition
Processors and value-addition entrepreneurs formed the largest stakeholder category (23.33%), followed by farmer organisations and cooperatives (20.00%) (Table 4). Government agencies and research, education and extension institutions each accounted for 16.67%. The remaining respondents represented traders, financial institutions and input or machinery suppliers. Together, these groups covered production, aggregation, processing, technology transfer, regulation, finance, logistics and markets.
| Sl. No. | Major stakeholder category | Stakeholders included | Frequency | Percentage |
|---|---|---|---|---|
| 1 | Farmer organisations and cooperative institutions | Coconut Producer Societies, cooperatives and progressive coconut farmers | 6 | 20.00 |
| 2 | Coconut processors and value-addition entrepreneurs | Coconut oil, virgin coconut oil, chips, milk, neera, coir and shell-product enterprises | 7 | 23.33 |
| 3 | Government and coconut-development agencies | Coconut Development Board, Department of Agriculture, Krishi Bhavans and local self-government institutions | 5 | 16.67 |
| 4 | Research, education and extension institutions | ICAR–CPCRI, Kerala Agricultural University, KVKs and extension specialists | 5 | 16.67 |
| 5 | Traders and marketing intermediaries | Collectors, commission agents, wholesalers, retailers and exporters | 3 | 10.00 |
| 6 | Financial and enterprise-development institutions | Commercial/cooperative banks, and enterprise-development agencies | 2 | 6.67 |
| 7 | Input and processing-machinery suppliers | Input dealers, equipment manufacturers and machinery suppliers | 2 | 6.67 |
| Total | 30 | 100.00 |
3.3 Interest-influence positions
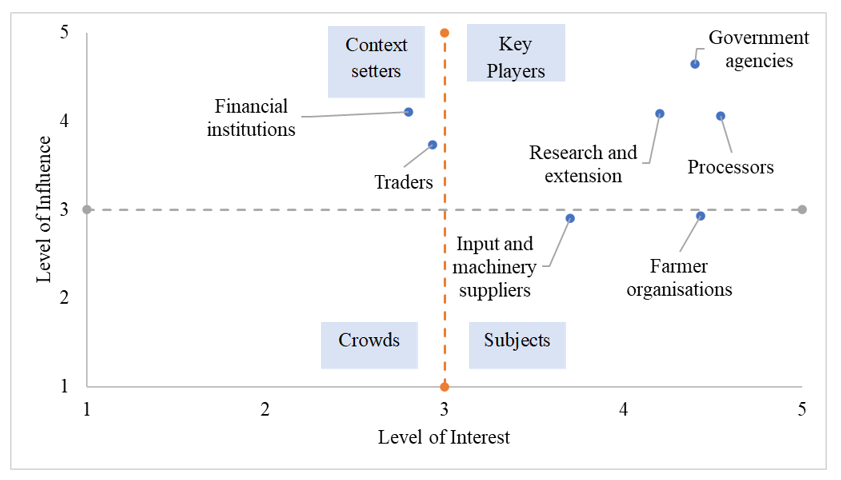
Government and coconut-development agencies recorded the highest influence score (4.64) and very high interest (4.40). Processors recorded the highest interest (4.54) and high influence (4.06). Research, education and extension institutions also combined high interest (4.20) with high influence (4.08) (Table 5). These three groups were therefore key players.
Farmer organisations showed very high interest (4.43) but a moderate influence score just below the quadrant threshold (2.93), placing them among subjects. Machinery suppliers were also subjects (interest 3.70; influence 2.90). Traders (interest 2.93; influence 3.73) and financial institutions (interest 2.80; influence 4.10) were context setters: their resources and decisions strongly affected the chain even though coconut value addition was not necessarily their dominant organisational priority. No category occupied the low-interest, low-influence quadrant (Figure 1).
| Stakeholder category | n | Mean interest score | Interest level | Mean influence score | Influence level | Matrix position |
|---|---|---|---|---|---|---|
| Farmer organisations and cooperative institutions | 6 | 4.43 | Very high | 2.93 | Moderate | Subject |
| Coconut processors and value-addition entrepreneurs | 7 | 4.54 | Very high | 4.06 | High | Key player |
| Government and coconut-development agencies | 5 | 4.40 | Very high | 4.64 | Very high | Key player |
| Research, education and extension institutions | 5 | 4.20 | High | 4.08 | High | Key player |
| Traders and marketing intermediaries | 3 | 2.93 | Moderate | 3.73 | High | Context setter |
| Financial and enterprise-development institutions | 2 | 2.80 | Moderate | 4.10 | High | Context setter |
| Input and processing-machinery suppliers | 2 | 3.70 | High | 2.90 | Moderate | Subject |
3.4 Constraints to value addition
Labour shortage was the most severe constraint in every district and overall (80.48), followed by high labour cost (76.17). The lack of a remunerative coconut price ranked third (73.27). Pest and disease incidence (69.99), shortage of skilled labour for value addition (67.28), high input cost (62.58) and inadequate irrigation (60.18) completed the seven constraints with overall mean scores above 60 (Table 6).
The next tier contained problems that directly affect the feasibility of processing and market expansion: lack of market information (52.57), inadequate storage (50.64), inadequate transport (47.91) and high machinery cost (47.43). The consistency of the first two ranks across all districts indicates a shared structural labour problem rather than an isolated local constraint.
| Constraint | Thiruvananthapuram | Kollam | Alappuzha | Overall |
|---|---|---|---|---|
| Shortage of labour | 79.37 (1) | 80.90 (1) | 81.17 (1) | 80.48 (1) |
| High labour cost | 76.77 (2) | 77.20 (2) | 74.53 (2) | 76.17 (2) |
| Lack of remunerative price for coconut | 74.80 (3) | 70.57 (4) | 74.43 (3) | 73.27 (3) |
| Pest and disease incidence | 66.13 (4) | 71.30 (3) | 72.53 (4) | 69.99 (4) |
| Shortage of skilled labour | 64.87 (6) | 70.13 (5) | 66.83 (5) | 67.28 (5) |
| High cost of inputs | 64.93 (5) | 62.17 (6) | 60.63 (6) | 62.58 (6) |
| Inadequate irrigation facilities | 58.97 (7) | 61.73 (7) | 59.83 (7) | 60.18 (7) |
| Lack of market information | 53.67 (8) | 52.67 (8) | 51.37 (9) | 52.57 (8) |
| Inadequate storage facilities | 51.70 (9) | 45.90 (11) | 54.33 (8) | 50.64 (9) |
| Inadequate transportation facilities | 47.37 (10) | 46.73 (10) | 49.63 (11) | 47.91 (10) |
| High cost of machinery | 44.10 (12) | 47.87 (9) | 50.33 (10) | 47.43 (11) |
| Lack of timely technical advice on coconut farming | 46.13 (11) | 42.80 (12) | 42.20 (12) | 43.71 (12) |
| Lack of awareness regarding coconut nutrient management | 43.07 (13) | 42.13 (13) | 42.13 (13) | 42.44 (13) |
| Inadequate credit | 36.63 (16) | 38.33 (15) | 39.80 (15) | 38.26 (14) |
| Lack of farmer-training programmes on coconut farming | 39.53 (15) | 34.70 (18) | 39.93 (14) | 38.06 (15) |
| High cost of seedlings | 42.17 (14) | 38.00 (16) | 30.57 (20) | 36.91 (16) |
| Inadequate subsidy | 29.97 (20) | 39.87 (14) | 38.77 (16) | 36.20 (17) |
| Non-availability of quality coconut seedlings | 34.73 (18) | 35.40 (17) | 31.70 (18) | 33.94 (18) |
| Insufficient extension activities such as demonstrations, group discussions and Kisan Melas | 35.20 (17) | 31.30 (20) | 30.67 (19) | 32.39 (19) |
| Non-availability of plant-protection equipment | 30.70 (19) | 32.63 (19) | 31.80 (17) | 31.71 (20) |
| Insufficient repayment period | 29.20 (21) | 27.67 (21) | 26.80 (21) | 27.89 (21) |
4 Discussions
The farmer profile and product distribution provide context for interpreting the institutional and constraint findings. Although 65 of the 90 growers had a degree or postgraduate qualification and the mean reported value-addition experience was 12.89 years, 87 growers marketed products classified as primary coconut products. This group included dehusked nuts, copra and traditionally processed oil; it should therefore not be interpreted as having undertaken no processing. Only two growers reported kernel-based products and one reported tender-coconut products.
The income-diversification results point in the same direction, while measuring a different aspect of the households’ activities. The overall mean Herfindahl–Hirschman Index (HHI) was 0.865, and 81 growers (90.00%) fell in the low-diversification category. Mean HHI was lowest in Thiruvananthapuram (0.832), followed by Kollam (0.877) and Alappuzha (0.885), but low diversification predominated in all three districts.
The predominance of low-income diversification in the present study is broadly consistent with earlier evidence from Kerala’s coconut sector. (Krishnakumar et al. 2013), in a study covering coconut-growing communities in Alappuzha and Kollam, reported a Herfindahl Index of 0.70 before the introduction of organised diversification interventions, indicating considerable concentration in the existing farming system.
More recent evidence from the Kerala Situation Assessment Survey of Agricultural Households showed that coconut value addition remained concentrated mainly in oil and cake production, while involvement in other products such as coconut milk, virgin coconut oil, charcoal and handicrafts was negligible or absent. The survey also estimated that only 3905.24 hundred households reported any involvement in value addition from the estimated 15383.99 hundred agricultural households engaged in coconut production (Department of Economics and Statistics 2025).
The seven stakeholder groups identified in the study represent the major steps in coconut-based value addition: primary production and aggregation, processing, institutional support, technology development and transfer, marketing, finance, and machinery or input supply. The presence of different actors across the value chain indicates that coconut value addition operates as an interconnected system rather than as an activity that can be undertaken by farmers independently.
Coconut processors and value-addition entrepreneurs formed the largest stakeholder category, closely followed by farmer organisations and cooperative institutions in the present study. Processors and different marketing intermediaries were identified as important actors in the coconut value chain of western Tamil Nadu (Kalidas and Mahendran 2024). Financial institutions and machinery suppliers constituted comparatively small proportions of the stakeholder sample. (Jayasekhar et al. 2024) identified inadequate working capital, interest free revolving funds and institutional credit as major limitations affecting coconut FPOs, while (Zainol et al. 2023) highlighted technological and socioeconomic constraints and the need for improved mechanisation and technology-delivery systems across the coconut value chain.
Government and coconut-development agencies recorded the highest influence score and were consequently placed in the key-player category. Their strong position reflects their important role in framing policies, implementing development programmes, providing subsidies and infrastructure, regulating quality, delivering training, promoting markets and coordinating different actors in the coconut value chain. This finding agrees with (Kumar and Kapoor 2010), who emphasised the need for coordinated action by the Coconut Development Board, State Department of Agriculture and State Department of Industries to promote coconut-based enterprises. (Zainol et al. 2023) similarly observed that strengthening the coconut value chain requires active government support through favourable policies, subsidies, research investment, infrastructure, technology dissemination and effective extension services.
Farmer organisations and cooperative institutions recorded the second-highest interest score (4.43), after processors and value-addition entrepreneurs (4.54). Their mean influence score (2.93) placed them among subjects. Their interest in better prices and additional income opportunities was therefore accompanied by comparatively limited perceived control over finance, technology, infrastructure and policy. However, the influence mean was only 0.07 below the threshold and represented six respondents. The classification should be interpreted as a borderline position rather than a sharp distinction from key players. Machinery suppliers were similarly close to the threshold (2.90; n = 2).
Research, education and extension institutions were identified as key players because of their strong interest and influence in coconut value addition. They support farmers and entrepreneurs by providing technical advice, training, demonstrations, product-development assistance, quality testing and enterprise guidance. This agrees with (Anithakumari et al. 2012), who highlighted the need for continued technical support to those engaged in farm-level coconut value addition and recommended that training programmes place greater emphasis on project preparation, communication and marketing skills.
Financial institutions and traders were classified as context setters because their influence was strong while their interest was only moderate. Banks and enterprise-development agencies play an important role in providing term loans and working capital for investment in machinery, storage and processing infrastructure. Traders, meanwhile, shape procurement practices, price transmission, transportation and market access. Their moderate level of interest may reflect the fact that coconut value addition forms only a small part of their broader institutional or commercial activities.
Labour shortage and high labour cost were the two highest-ranked constraints in all three districts. Their consistency across locations indicates that labour is a structural problem affecting the coconut sector rather than a district-specific difficulty. Coconut production involves specialised and physically demanding activities such as climbing, harvesting and plant-protection operations. (Kamar et al. 2019) similarly identified high labour cost, non-availability of labour and severe pest and disease incidence among the major constraints reported by coconut growers in Thiruvananthapuram.
The third-ranked constraint, lack of a remunerative price for coconut, together with lack of market information, inadequate storage and inadequate transport, forms a distinct marketing and logistics cluster. Marketing-related problems were also observed among coconut growers in Thanjavur district (Dhara et al. 2016), while (Padma 2024) found that securing a fair market price was a leading concern among growers in Coimbatore.
The stakeholder map and constraint rankings suggest that each stakeholder group should address problems according to its authority and available resources. Government agencies, research and extension institutions, and processors should take the lead, as all three were identified as key players.
| Constraints identified | Stakeholders with primary responsibility | Recommended response |
|---|---|---|
| Labour shortage; high labour cost; skilled-labour shortage | Government agencies; farmer organisations | Establish trained climbing and machinery-service groups, custom-hiring arrangements and subsidies for labour-saving equipment |
| Lack of remunerative price; lack of market information | Government and coconut-development agencies | Price-support and procurement mechanisms; market-information dissemination |
| Pest and disease incidence; inadequate irrigation; skill gaps | Research and extension institutions | Technology demonstration and IPM/IDM advisories; efficient-irrigation packages; localised training on value-addition and harvesting technologies |
| High input cost | Farmer organisations and cooperatives; Government agencies | Organise bulk procurement, facilitate input services and target subsidies or credit towards essential production inputs |
| Inadequate storage and transport | Government agencies; farmer organisations; processors | Develop shared storage, aggregation and transport facilities linked with processing clusters |
| High machinery cost | Government agencies; financial institutions | Establish common facility centres, machinery banks, leasing facilities |
The proposed responses in Table 7 connect constraint priorities with the functions of lead and supporting stakeholders. Government and farmer organisations are proposed to lead collective labour arrangements, research and extension institutions to lead technology and skills support, and government agencies to lead public price-support and procurement measures. Traders, processors and financial institutions contribute buyer linkages, infrastructure and finance.
Although farmer organisations and cooperatives were classified as subjects rather than key players, they can play an important role in addressing labour shortages and high labour costs. Collective solutions are generally more practical than individual action at the farm level. Custom-hiring centres for coconut-harvesting and de-husking equipment, organised through Coconut Producer Societies, mirror the recommendation made for Kerala’s paddy-farming collectives by (Prabha et al. 2024), who suggested that access to machinery under mechanisation-support schemes could offset labour shortages more effectively.
Government and coconut-development agencies, which had the highest influence and were identified as key players, are better suited to address constraints like the lack of remunerative prices and market information. Since these agencies already implement processing and marketing-support schemes, greater attention should be given to improving access to market information and ensuring better prices in the study districts.
Research, education and extension institutions can lead pest and disease management, efficient irrigation and practical training for value addition. For high input costs, their role is to improve input-use efficiency, while farmer organisations lead collective purchasing and government agencies support suitable input services and financial assistance. Skilled-labour shortages require dedicated processing and quality-control training with support from processors.
5 Conclusion
The study links three strands of evidence from southern Kerala: 87 of 90 surveyed growers marketed primary product groups, 81 of 90 fell in the low HHI-diversification group, and labour shortage and labour cost ranked first and second in each district. The stakeholder map identifies government and coconut-development agencies, processors, and research and extension institutions as key players. Farmer organisations had high interest (4.43) but influence just below the quadrant threshold (2.93). These results help prioritise institutional coordination while distinguishing measured household income concentration from unmeasured gains due specifically to processing.
Labour shortage and high labour cost were the most severe constraints in all three districts, followed by lack of remunerative prices, pest and disease incidence and shortage of skilled labour. Market information, storage and transport represented additional constraints affecting processing and market expansion. Findings describe the interviewed respondents and should not be generalised as representative district estimates.
The proposed framework (Table 7) assigns collective labour mobilisation to government agencies and farmer organisations, technology and skills support to research and extension institutions, public pricing measures to government, and market linkages to coordinated participation by traders, processors and farmer organisations. Financial institutions and machinery suppliers support shared facilities, equipment access and enterprise investment. The framework provides priorities for coordination; its effects on participation, price realisation and net returns remain to be evaluated.
Future research could use a documented sampling frame and record which households actually undertake each processing activity. Pilot evaluations of shared equipment, skills training, collective processing and buyer linkages could then test whether the actor-linked responses proposed here increase participation and improve growers’ net returns. District-specific comparisons would help determine which interventions require a common regional approach and which should be adapted to local conditions.
Artificial intelligence (AI) tools were used solely for grammatical correction and language improvement. The authors reviewed and verified all content and take full responsibility for the accuracy and integrity of the manuscript.
References
Publication Information
- Submitted: 18 September 2026
- Accepted: 05 October 2026
- Published (Online): 07 October 2026
Reviewer Information
Reviewer 1:
AnonymousReviewer 2:
Anonymous
The statements, opinions and data contained in all publications are solely those of the individual author(s) and contributor(s) and not of the publisher and/or the editor(s).
The publisher and/or the editor(s) disclaim responsibility for any injury to people or property resulting from any ideas, methods, instructions or products referred to in the content.
© Copyright (2026): Author(s). The licensee is the journal publisher. This is an Open Access article distributed under the terms of the Creative Commons Attribution-NonCommercial-NoDerivatives 4.0 International License, which permits non-commercial use, sharing, and reproduction in any medium, provided the original work is properly cited and no modifications or adaptations are made.