
Performance Evaluation and Late Blight Reaction of Advanced Potato Genotypes for Yield and Quality Traits in Bekoji, Southeastern Ethiopia
The research aimed to assess potato genotypes that possess high yield and tuber quality characteristics and yield traits. The study was arranged by randomized complete block design with three replications and was executed at the Bekoji substation during the main cropping seasons of 2022 and 2023. Read more …

The research aimed to assess potato genotypes that possess high yield and tuber quality characteristics and yield traits. The study was arranged by randomized complete block design with three replications and was executed at the Bekoji substation during the main cropping seasons of 2022 and 2023. The results revealed that all the traits except days emergence showed significant differences among the genotypes. The genotypes varied for dry matter content, specific gravity, and total starch content, which ranged from 18.32% to 23.66%, 1.07 to 1.097 g/cm3, and 12.03% to 17.08%, respectively. The genotype CIP315009.71 had the highest specific gravity, dry matter content, and total starch content. The four advanced clones CIP315003.132, CIP315008.30, CIP315009.71, and CIP315004.61 produced a total tuber yield that exceeded the released variety, Burka. The identified genotypes may provide useful breeding material for improving yield and processing-related tuber quality.
Tuber quality, Processing quality traits, Potato genotypes
1 Introduction
Potato (Solanum tuberosum L.) is the fourth most produced crop globally, with approximately 383 million tons harvested from 16.8 million hectares annually (Food and Agriculture Organization of the United Nations 2023). Cultivated in more than 150 countries under temperate, subtropical, and tropical conditions, potatoes represent a staple food for approximately one billion people, about half of whom live in developing countries (Placide et al. 2022). Production has significantly increased in developing regions like Africa, reaching 26 million metric tons, with both production and harvested areas more than doubling over the last two decades (Tadesse et al. 2025). Primarily cultivated for human consumption, potatoes are a vital, well-balanced source of energy and nutrition. They provide high levels of carbohydrates, quality proteins with an excellent amino acid balance, essential minerals (such as calcium and potassium), and antioxidants like polyphenols, carotenoids, and tocopherols (Lombardo et al. 2013; Ierna and Mauromicale 2022; Seid et al. 2025; André Devaux et al. 2021; Birch et al. 2012; FAO, IFAD, UNICEF, WFP and WHO 2020; Bailey et al. 2015). Beyond nutrition, the crop makes a substantial economic contribution to national incomes through employment, income generation, and export earnings across Asia, Africa, and Latin America (A. Devaux et al. 2021; Lutaladio and Castaidi 2009). In Ethiopia, the potato is an important crop for food security and income generation among smallholder farmers, particularly in highland regions where agroecological conditions support its cultivation (Gebremedhin et al. 2022; Tessema et al. 2022; Abebe et al. 2022). Reflecting its growing role in the agricultural economy, Ethiopia’s potato cultivation area expanded significantly over the past decade from 200,000 hectares in 2013 to 300,000 hectares in 2023 (Central Statistical Agency 2023). During the main rainy season alone, they are grown by over 1.12 million households on more than 78,000 hectares of land, with over 65% of the produce utilized for household food and nearly 20% marketed for income (Ethiopian Statistical Service (ESS) 2022). Ethiopian potatoes are traditionally consumed boiled or cooked in various traditional dishes like wot (it’s a local dish/stew) or mixed with other vegetables as a salad in urban areas (Bezabih and Mengistu 2011). However, consumption habits are changing; potato chips, crisps, French fries, and roasted potatoes have become common practices recently, particularly in major cities such as Addis Ababa, Hawassa, Adama, Mekele, and Dire Dawa (Bezabih and Mengistu 2011).
Driven by maximum potato productivity potential, a fast-growing processing sector is emerging in different countries, including Ethiopia. Potato chips and French fries have become widespread across local hotels, restaurants, supermarkets, and small shops. Consequently, processing companies like “Sun Chips” are emerging, and the national demand for processing-type potatoes is expanding alongside broader food security goals (Mohammed 2016). Before selecting a variety for processed products like chips, growers must consider market potential alongside specific tuber quality traits (Kimondo 2007). To satisfy the technical demands of the processing industry, potato tubers must fulfill precise tuber quality traits, including high specific gravity, low reducing sugar, and high dry matter (DM) content (Kimondo 2007; Rana and Pandey 2007). Various research institutes in Ethiopia have released over 40 new potato varieties; however, these historical initiatives focused primarily on achieving high yields, resistance to late blight, and broad adaptability (Mohammed 2016). Apart from a few recently introduced varieties, the country’s potato research has focused less on tuber quality traits and processing parameters. These limited processing- parameters varieties have yet to meet the surging demands of the domestic chip and French fry industries. Thus, this study aimed to assess potato genotypes that possess advantages for tuber quality traits relevant to processing and yield traits.
2 Materials and Methods
2.1 Description of the study area for field experiment
The field experiment was conducted at the Bekoji testing location during the 2022 and 2023 main cropping seasons (June-November of 2022 and June-November 2023). Bekoji is the major potato-growing area in the Arsi zone of the Oromia region, which is about 237 km from Addis Ababa. The soil composition in the study area is primarily clay, which is acidic in nature, a characteristic that can influence plant growth and pest behavior. The agro-climatic conditions in this region are classified as wet, with an average annual rainfall of 1,020 mm. Detailed information about the testing site is described in Table 1 .
| Location | Latitude | Longitude | Altitude (m) | Mean annual rainfall (mm) | Min. temperature (°C) | Max. temperature (°C) | Soil type |
|---|---|---|---|---|---|---|---|
| Bekoji | 07°32′37″ N(or ~7.5436° N) | 39°15′21″ E (~39.2558° E) | 2780 | 1020 | 7.9 | 18.6 | Clay classified as Nitisols |
| Cropping season | Cropping months | Mean monthly rainfall (mm) | Minimum temperature (°C) | Maximum temperature (°C) | Relative humidity (%) |
|---|---|---|---|---|---|
| 2022 | May | 82.9 | 6.5 | 20.8 | 58 |
| 2022 | June | 157.2 | 4.1 | 20.4 | 73 |
| 2022 | July | 298.3 | 4.2 | 18.9 | 84 |
| 2022 | August | 192.9 | 4.2 | 18.9 | 83 |
| 2022 | September | 110.0 | 4.5 | 19.1 | 78 |
| 2022 | October | 88.2 | 2.8 | 20.5 | 69 |
| 2023 | May | 75.2 | 3.7 | 21.8 | 75 |
| 2023 | June | 83.6 | 3.6 | 23.6 | 79 |
| 2023 | July | 214.0 | 3.4 | 23.5 | 84 |
| 2023 | August | 195.3 | 3.7 | 20.9 | 86 |
| 2023 | September | 101.1 | 3.8 | 19.7 | 79 |
| 2023 | October | 58.5 | 3.5 | 20.7 | 80 |
2.2 Field experimentation, Experimental design and crop husbandry
Fourteen advanced potato genotypes with one standard check (Burka) were evaluated. Detailed information about the experimental materials were described in Table 3 below. The trial was conducted using a randomized complete block design with three replications to evaluate the selected fourteen genotypes along with standard check (Table 2). Medium-sized (35-45 mm in diameter) and vigorous sprouted potato tubers were planted in the first week of June at a spacing of 75 cm between rows and 30 cm between plants, respectively, in a gross plot size of 9 m2 (3 m x 3 m) which accommodated 40 plants. Agronomic practices were carried out at the appropriate times to facilitate root, stolon, and tuber growth for the crop. To prevent late blight disease, a fungicide (Redomil Gold MZ 68 WG) was sprayed once during the cropping season. The scientific rationale behind this practice is not to prevent the target disease under evaluation, but rather to establish an experimental baseline by eliminating confounding biotic variables, standardizing plant physiological health, and preventing non-target pathogen or vector interference that could skew phenotypic data. Two weeks before harvesting, as the crop attained maturity (yellowing of stems and senescence of leaves), the potato vines were cut (dehaulmed) to allow the tuber skins to harden and mature.
| No. | Treatments | Status | No. | Treatments | Status |
|---|---|---|---|---|---|
| 1 | CIP315003.25 | Advanced clone | 9 | CIP315004.61 | Advanced clone |
| 2 | CIP315009.70 | Advanced clone | 10 | CIP315003.83 | Advanced clone |
| 3 | CIP315003.132 | Advanced clone | 11 | CIP315003.166 | Advanced clone |
| 4 | CIP315008.182 | Advanced clone | 12 | CIP315010.161 | Advanced clone |
| 5 | CIP315008.160 | Advanced clone | 13 | Burka | Registered variety |
| 6 | CIP315008.154 | Advanced clone | 14 | CIP315004.13 | Advanced clone |
| 7 | CIP315004.113 | Advanced clone | 15 | CIP315009.30 | Advanced clone |
| 8 | CIP315009.71 | Advanced clone |
2.3 The experimental designs and field trial management
The trial was conducted using a randomized complete block design with three replications to evaluate the selected fourteen genotypes along with standard check (Table 2). Medium-sized (35-45 mm in diameter) and vigorous sprouted potato tubers were planted in the first week of June at a spacing of 75 cm between rows and 30 cm between plants, respectively, in a gross plot size of 9 m2 (3 m x 3 m) which accommodated 40 plants. Agronomic practices were carried out at the appropriate times to facilitate root, stolon, and tuber growth for the crop. To prevent late blight disease, a fungicide (Redomil Gold MZ 68 WG) was sprayed once during the cropping season. The scientific rationale behind this practice is not to prevent the target disease under evaluation, but rather to establish an experimental baseline by eliminating confounding biotic variables, standardizing plant physiological health, and preventing non-target pathogen or vector interference that could skew phenotypic data. Two weeks before harvesting, as the crop attained maturity (yellowing of stems and senescence of leaves).
2.4 Data collected
2.4.1 Data collected a plot basis
Days to 50% emergence (days): The number of days from the date of planting to the day when the first sprout breaks through the soil surface in a plot.
Days to 50% flowering (days): The number of days from the date of planting to when about 50% of the plants produced flowers. Days to maturity (days): The number of days from the date of planting to maturity
2.4.2 Data collected on plant
Number of main stem/hills: data on this parameter was recorded as the average stem number counted from ten hills per plot at 50% flowering. Only stems that had directly grown from the mother tuber and acted as an independent plant above the soil were considered as main stems.
Plant height (cm): The plant height was measured from five samples using measuring tape from ground level to the tip of the plant expressed in centimeters and the mean was computed.
Average tuber weight (g): was determined by dividing the total fresh tuber yield to their respective total tubers number.
Late blight: Disease recorded commenced on 22 August 2022 and 2023, which was 46 days post-planting, right after disease symptoms manifested susceptible genotypes and was conducted every 7 days until most of the genotypes reached physiological maturity. The occurrence and severity of the disease were evaluated in accordance with the CIP (2006) guidelines. The Area under the Disease Progress Curve (AUDPC) was calculated as well from disease severity recorded at various set date intervals.
| CIP Scale | Value | Blight (%) Limits | Symptoms |
|---|---|---|---|
| 1 | 0 | — | No late blight observable. |
| 2 | 2.5 | Traces - < 5 | Late blight present. Maximum 10 lesions per plant. |
| 3 | 10 | 5 - < 15 | Plants look healthy, but lesions are easily seen at closer distance. Maximum foliage area affected by lesions or destroyed corresponds to no more than 20 leaflets. |
| 4 | 25 | 15 - < 35 | Late blight easily seen on most plants. About 25% foliage is covered with lesions or destroyed. |
| 5 | 50 | 35 - < 65 | Plots look green; however, all plants are affected. Lower leaves are dead. About half the foliage area destroyed. |
| 6 | 75 | 65 - < 85 | Plots look green with brown flecks. About 75% of each plant is affected. Leaves of the lower half of plants are destroyed. |
| 7 | 90 | 85 - < 95 | Plots neither predominantly green nor brown. Only top leaves are green. Many stems have large lesions. |
| 8 | 97.5 | 95 - < 100 | Plot is brown-colored. A few top leaves still have some green areas. Most stems have lesions or are dead. |
| 9 | 100 | 100 | All leaves and stems dead. |
2.4.3 Area under the disease progress curve (AUDPC)
Area under the disease progress curve is used to combine multiple disease severity into single value. The area under the disease progress curve was obtained by following formula (Campbell and Madden 1990):
\[ \mathrm{AUDPC} = \sum_{i=1}^{n-1}[\frac{Y_i + Y_{i+1}}{2}\times (t_{i+1}-t_i)] \]
where, \(Y_i\) = severity % on the ith date, \(T_i\) = date on which disease was scored and n = total number of dates on which disease was scored
2.4.4 Yield and yield components
Total tuber yield (t ha-1): The total tuber yield per plot was recorded by adding up the weights of marketable and unmarketable tuber and later extrapolated to per hectare. Total tuber yield t ha-1 = Marketable tuber yield t ha-1 + Unmarketable tuber yield t ha-1.
Marketable tuber yield (t ha-1): Tubers that harvested from each net plot area, free from mechanical damage, disease and insect pest damages and medium to large in size which (>25g) were considered as marketable tuber yield. Then the yield was converted by calculation to total marketable tuber yield ton per hectares.
Unmarketable tuber yield (t ha-1): Tubers diseased, damaged, small in size (potato tuber <25g) were grouped as unmarketable tuber yield per plot. Then the yield measured by kg of unmarketable tuber per plot. Then it was converted to unmarketable tuber yield tone hectare.
Bulking rate (g day-1): Was calculated as total weight of tubers harvested from net plot divided by number of days taken from days to 50% flowering to physiological maturity (De Haan et al. 2014).
\(\mathrm{Bulking rate (g/day)} = \frac{W_{net}}{D maturity-D flowring}\)
Where,
• \(W_{net}\): Total fresh weight of potato tubers harvested from the net plot area, measured in grams (g).
• D flowering: Number of days from planting to 50% flowering.
• D maturity: Number of days from planting to physiological maturity (usually when 90% of the foliage loses its green color and yellows)
2.4.5 External and internal tuber quality traits
Specific gravity of tubers (Sg) (gcm-3) The specific gravity of tubers was determined using the air, underwater weight method. Five kilograms of fresh tubers as a composite sample from different shapes and sizes were randomly selected from each plot per genotype in a net bag and labeled. The tubers were washed with tap water and allowed to dry. Then weight in air followed by weight in water were taken. The specific gravity of each sample was determined according to the formula given by Gould (1995).
Dry matter content (%) Tuber dry matter content (DMC) was calculated according to Porras et al. (2014). Five tubers of each variety were chopped (about 500 g total) into small 1–2 cm cubes. The tubers were mixed thoroughly and divided in to two sub-samples of 200 g each recording their fresh weight and allowed to dry. Subsequently, each sub-sample was placed in an oven dry set at 80 °C and dried for 48 h until constant weight. Each sub-sample was weighed immediately and recorded as dry weight. After getting the constant dry weight from each sample, the dry matter content for each sub-sample was then computed as one sample.
Total starch content (g/100 g):- The total starch content was estimated from dry matter percent. Starch content in percent was calculated according to AOAC (Association of Official Analytical Chemists 1980). Starch content (%) = 17.55 + 0.891 * (tuber dry weight% - 24.182).
Tuber shape: This will be determined by (Gómez 2000), who described eight types of tuber shape, which will be transformed into numerical scores from 1 to 8, where 1 = compressed, 2 = round, 3 = ovate, 4 = obovate, 5 = elliptic, 6 = oblong, 7 = long-oblong and 8 = elongate.
Eye depth: will be determined by (Wooster & Farooq, 1995), who described nine types of tuber eye depth, which will be transformed into numerical scores from 1 to 9, where 1 = Very deep, 2 = Very deep to deep, 3 = Deep, 4 = Deep to medium, 5 = Medium, 6 = Medium to shallow, 7 = Shallow, 8 = Shallow to very shallow, 9 = Very shallow.
Tuber skin color: will be assessed by (Gómez 2000), from 1–9 scale, where 1= white-cream, 2= yellow, 3=orange, 4=brown, 5=pink, 6=red, 7=red-purple, 8=purple and 9= Dark purple - black.
Tuber flesh color: will be evaluated by (Gómez 2000), from 1–7, where 1=white, 2=cream, 3=yellow-cream (bright), 4=yellow, 5=red, 6=purple, 7=violet.
Tuber Appearance (Tuber Appearance): will be evaluated by (De Haan et al. 2014)
2.5 Statistical analysis
2.5.1 Analysis of variance
The linear model (lm) function from the stats package in R software (version of 3.6.3) (R Core Team 2020) was employed to analyze the data collected for each trait through analysis of variance (ANOVA), following the methodology described by Gomez and Gomez (Gomez and Gomez 1984). The assumptions of ANOVA for every data point were made prior to the analysis, and a combined data analysis across years was performed for all traits. A least significant difference was employed to analyze the mean performance of potato genotypes at a significance level of 5%. Descriptive statistics was used to describe qualitative data.
The combined analysis model for a randomized complete block design (RCBD) across years is expressed as:
\[ Y_{ijk} = \mu + Y_i + R_{j(i)} + G_k + (YG)_{ik} + \varepsilon_{ijk} \]
Where, \(Y_{ijk}\): Observed value of the trait for the \(k\)-th genotype in the \(j\)-th replication within the \(i\)-th year, \(\mu\): Overall mean, \(Y_i\): Effect of the \(i\)-th year (\(i = 1, 2, \ldots, y\)), \(R_{j(i)}\): Effect of the \(j\)-th replication nested within the \(i\)-th year (\(j = 1, 2, \ldots, r\)), \(G_k\): Effect of the \(k\)-th genotype (\(k = 1, 2, \ldots, t\)), \((YG)_{ik}\): Interaction effect between the \(i\)-th year and the \(k\)-th genotype and \(\varepsilon_{ijk}\): Random experimental error associated with the observation of the \(k\)-th genotype in the \(j\)-th replication within the \(i\)-th year.
2.5.2 Pearson correlation analysis
The graphical outputs of the Pearson correlation matrix were piloted using ggcorrplot using the ggplot2 package of R software (R Core Team 2020).
3 Results
3.1 Analysis of variance
From the results, analysis of variance (ANOVA) revealed that there were highly significant (\(p≤\) 0.01) differences in agronomic, quality, and tuber yield traits among the 14 potato genotypes and standard check, except for days to fifty percent (50%) emergence and days to maturity. G×Y is significant for marketable yield, total yield (0.016), dry matter, bulking rate, late blight, average tuber weight, flowering and stem number (Table 5; Table 6).
| Source of variation | df | Days to Emergence | Days to 50% Flowering | Days to 50% maturity | Plant Height (cm) | Average stem number per plant | Dry Matter content | Specific gravity | Starch content |
|---|---|---|---|---|---|---|---|---|---|
| Year | 1 | 98.178 | 413.88 | 4825.30 | 440.90 | 36.35 | 4.7334 | 9.0e-05 | 4.22 |
| Replication | 2 | 8.233 | 15.74 | 96.50 | 87.63 | 2.14 | 2.7164 | 9.3e-05 | 2.42 |
| Genotypes | 14 | 2.029 | 25.78 | 75.40 | 507.77 | 5.99 | 10.0196 | 2.4e-04 | 8.92 |
| Year: Genotype | 14 | 2.130 | 11.73 | 87.80 | 109.13 | 2.28 | 6.4850 | 1.3e-04 | 5.77 |
| Year: Replication | 2 | 1.011 | 1.08 | 209.70 | 124.92 | 0.85 | 0.4930 | 1.3e-05 | 0.44 |
| Error | 56 | 3.706 | 5.02 | 75.70 | 78.25 | 1.06 | 3.3163 | 9.5e-05 | 2.95 |
| Significance | ns | *** | ns | *** | *** | ** | ** | ** |
| Source of variation | df | Late blight reaction | Marketable yield | Unmarketable yield | Total Yield | Average tuber weight | Tuber bulking rate |
|---|---|---|---|---|---|---|---|
| Year | 1 | 274.58 | 6793.80 | 2.00 | 6562.50 | 16043.20 | 329790.00 |
| Replication | 2 | 11.12 | 16.50 | 0.27 | 20.00 | 9695.00 | 150885 .00 |
| Genotypes | 14 | 66.54 | 341.40 | 2.99 | 356.30 | 27159.50 | 177582.00 |
| Year: Genotype | 14 | 19.32 | 288.700 | 1.03 | 284.30 | 11439.00 | 199282.00 |
| Year: Replication | 2 | 3.48 | 11.20 | 1.73 | 19.00 | 3649.20 | 33011.00 |
| Error | 56 | 5.11 | 127.20 | 0.95 | 126.20 | 5520.30 | 82501.00 |
| Significance | *** | ** | ** | ** | *** | * |
3.2 Mean performances of genotypes for agronomic traits
From the results, analysis of variance (ANOVA) revealed that there were highly significant (\(p\)≤0.01) differences in agronomic, quality, and tuber yield traits among the 15 potato genotypes, except for days to fifty percent (50%) emergence ( Table 7). Days to 50% flowering, days to 50% maturity, plant height, and average stem number varied from 67.33 to 74.00 (days), 108.50 to 120.83 (days), 68.83 to 103.03 (cm), and 3.53 to 7.5 per plant, respectively (Table 7). Among the studied genotypes, CIP315009.30 exhibited earlier flowering than the other genotypes, while CIP315003.132 was late to flower. Genotype CIP315009.70 showed earlier maturity than the other genotypes, while CIP315004.113 was late to maturity. The highest plant height was obtained from advanced clone CIP315003.25 (103.03 cm ), followed by CIP315008.154 (91. 00 cm ) and CIP315008.160 (88.83 cm ), while the lowest plant height was observed for CIP315003.83 (66.93 cm ). Relatively, the highest average stem number was observed from genotype CIP315008.154 (7.5). On the other hand, the lowest average stem number was counted from genotype CIP315004.113 (3.53) (Table 7).
| S/No | Genotypes | Days to emergence | Days to 50% flowering | Days to maturity | Plant height | Average stem number |
|---|---|---|---|---|---|---|
| 1 | CIP315004.61 | 15.33 | \(71.17^{c-f}\) | \(120.00^{ab}\) | \(85.83^{b-e}\) | \(3.93^{ef}\) |
| 2 | CIP315009.30 | 15.00 | \(67.33^{h}\) | \(117.00^{a-c}\) | \(81.50^{b-f}\) | \(4.80^{b-e}\) |
| 3 | CIP315010.161 | 14.67 | \(73.67^{a-c}\) | \(116.00^{a-c}\) | \(72.33^{fg}\) | \(5.93^{b}\) |
| 4 | CIP315003.132 | 14.50 | \(74.00^{a}\) | \(118.67^{ab}\) | \(82.33^{b-f}\) | \(5.43^{bc}\) |
| 5 | CIP315004.113 | 14.33 | \(71.33^{b-f}\) | \(120.83^{a}\) | \(80.00^{c-f}\) | \(3.53^{f}\) |
| 6 | CIP315008.160 | 14.33 | \(68.50^{gh}\) | \(115.50^{a-c}\) | \(88.83^{bc}\) | \(5.37^{bc}\) |
| 7 | CIP315003.83 | 14.17 | \(68.83^{f-h}\) | \(111.30^{a-c}\) | \(66.93^{g}\) | \(4.50^{c-f}\) |
| 8 | CIP315003.166 | 14.00 | \(69.17^{e-h}\) | \(113.30^{a-c}\) | \(68.83^{g}\) | \(4.17^{d-f}\) |
| 9 | CIP315003.25 | 14.00 | \(71.67^{a-e}\) | \(118.50^{a-c}\) | \(103.03^{a}\) | \(5.23^{b-d}\) |
| 10 | CIP315009.71 | 14.00 | \(73.83^{ab}\) | \(118.50^{a-c}\) | \(77.00^{d-g}\) | \(4.77^{b-e}\) |
| 11 | CIP315009.70 | 13.83 | \(73.17^{a-c}\) | \(108.50^{c}\) | \(79.63^{c-f}\) | \(4.87^{b-e}\) |
| 12 | CIP315008.182 | 13.67 | \(70.17^{d-g}\) | \(114.67^{a-c}\) | \(86.33^{b-d}\) | \(5.90^{b}\) |
| 13 | CIP315004.13 | 13.50 | \(71.17^{c-f}\) | \(116.67^{a-c}\) | \(76.00^{e-g}\) | \(4.13^{def}\) |
| 14 | Burka | 13.33 | \(72.67^{a-d}\) | \(110.67^{bc}\) | \(76.60^{d-g}\) | \(5.80^{b}\) |
| 15 | CIP315008.154 | 13.33 | \(71.17^{c-f}\) | \(114.67^{a-c}\) | \(91.00^{b}\) | \(7.50^{a}\) |
| Mean | 14.13 | 71.19 | 115.66 | 81.08 | 5.06 | |
| CV (%) | 13.62 | 3.15 | 7.52 | 10.91 | 20.38 | |
| p-value | ns | < 0.01 | < 0.01 | < 0.01 | < 0.01 |
3.3 Mean performances of genotypes for tuber internal quality traits
Studied potato genotypes showed significant differences in internal quality traits (specific gravity, dry matter content, and total starch content). The genotypes varied for dry matter content, specific gravity, and total starch content, which ranged from 18 .32% to 23.66%, 1.07 to 1.097 g cm -3, and 12.03% to 17.08%, respectively. The genotype CIP315009. 71 had the highest specific gravity, dry matter content, and total starch content (Table 8). These differences might be related to genetic variations among potato genotypes. Furthermore, higher dry matter content in these genotypes is observed, as starch and dry matter contents of potatoes are directly related to each other. Genotypes with high specific gravity showed a higher percentage of dry matter content and total starch content. Since starch is the most substantial major element within plant tissue, its buildup directly elevates the total density (specific gravity) and decreases the relative water content, thus enhancing the overall dry matter. Among the studied genotypes, genotype CIP315008.160 showed the lowest specific gravity, dry matter content, and total starch content.
| S/No | Genotypes | Dry matter (%) | Specific gravity | Total starch (g/100 g) |
|---|---|---|---|---|
| 1 | CIP315004.61 | \(21.89^{a-d}\) | \(1.09^{a-c}\) | \(15.39^{a-d}\) |
| 2 | CIP315009.30 | \(21.49^{b-d}\) | \(1.09^{bc}\) | \(15.04^{b-d}\) |
| 3 | CIP315010.161 | \(21.69^{a-d}\) | \(1.09^{a-c}\) | \(15.21^{a-d}\) |
| 4 | CIP315003.132 | \(22.25^{a-c}\) | \(1.09^{ab}\) | \(15.75^{a-c}\) |
| 5 | CIP315004.113 | \(19.9^{de}\) | \(1.08^{cd}\) | \(13.62^{de}\) |
| 6 | CIP315008.160 | \(18.32^{e}\) | \(1.07^{d}\) | \(12.03^{e}\) |
| 7 | CIP315003.83 | \(20.29^{c-e}\) | \(1.08^{cd}\) | \(13.89^{c-e}\) |
| 8 | CIP315003.166 | \(20.75^{b-d}\) | \(1.08^{bc}\) | \(14.33^{b-d}\) |
| 9 | CIP315003.25 | \(22.45^{ab}\) | \(1.09^{ab}\) | \(15.93^{ab}\) |
| 10 | CIP315009.71 | \(23.66^{a}\) | \(1.09^{a}\) | \(17.08^{a}\) |
| 11 | CIP315009.70 | \(22.44^{ab}\) | \(1.09^{ab}\) | \(15.93^{ab}\) |
| 12 | CIP315008.182 | \(20.51^{b-d}\) | \(1.08^{b-d}\) | \(14.12^{b-d}\) |
| 13 | CIP315004.13 | \(22.22^{a-c}\) | \(1.09^{a-c}\) | \(15.72^{a-c}\) |
| 14 | Burka | \(22.12^{a-c}\) | \(1.09^{ab}\) | \(15.62^{a-c}\) |
| 15 | CIP315008.154 | \(21.44^{b-d}\) | \(1.08^{bc}\) | \(14.99^{b-d}\) |
| Mean | 21.43 | 1.09 | 14.98 | |
| Range | 18.32 - 23.66 | 1.07 - 1.097 | 12.03 - 17.08 | |
| CV (%) | 8.50 | 0.89 | 11.47 | |
| p-value | < 0.01 | < 0.01 | < 0.01 |
3.4 Mean performances of genotypes for tuber yield
The examined potato genotypes exhibited a broad spectrum of variation in overall tuber yield, varying from 38.76 to 61. 94 t ha-1 , with an average yield of 49. 99 t ha-1 (Table 9). The total tuber yield of the released variety (Burka) 51.85 t ha-1. The four advanced clones CIP315003.132, CIP315008.160, CIP315009.71, and CIP315004.61 produced a total tuber yield that exceeded the average tuber yield of the released variety, Burka. Nonetheless, genotype CIP315003.83 produced a low overall tuber yield. Marketable tuber yield varied between 35.79 and 57.57 t ha-1 , with an average performance of 46.34 t ha-1 . The four advanced clones produced a greater total tuber yield compared to the released variety (Burka). The four advanced clones CIP315003.132, CIP315008.160, CIP315009.71, and CIP315004.61 achieved a total tuber yield higher than the mean tuber yield of the released variety, Burka. The average late blight severity (%) varied from 3.00 to 15.67, with an overall average of 6.48. The greatest late blight severity (15.67%) was observed in CIP315003.166, while the least severity (3.00%) was noted in CIP315003.25 (Table 9). The average tuber weight of the assessed genotypes varied from 222.37 to 452. 35 g , with a total mean of 304. 89 g . The genotype CIP315004.61 recorded the highest average tuber weight, while CIP315003.83 recorded the lowest average tuber weight. The average tuber bulking rate of the assessed genotypes varied from 835.07 to 1440.89 g/day, with a total mean of 1159. 54 g /day. The genotype CIP315003.132 recorded the highest average tuber bulking rate, while CIP315004.113 recorded the lowest average tuber bulking rate (Table 9). Differences in genetic potential, environmental adaptation, and their interaction (G×E interaction) primarily drive yield variations among potato genotypes. These differences directly appear in essential yield-contributing characteristics such as the number of tubers per plant, average tuber weight, and days until maturity, which together define the ultimate marketable tuber yield.
| S/No | Genotypes | Total marketable yield (t/ha) | Total unmarketable yield (t/ha) | Total yield (t/ha) | Late blight | Average tuber weight (g) | Tuber bulking rate (g/days) |
|---|---|---|---|---|---|---|---|
| 1 | CIP315004.61 | \(54.76^{ab}\) | \(3.28^{cd}\) | \(58.04^{ab}\) | \(4.72^{e-i}\) | \(452.35^{a}\) | \(1183.07^{a-e}\) |
| 2 | CIP315009.30 | \(49.81^{a-c}\) | \(2.95^{d}\) | \(52.7^{a-c}\) | \(5.40^{d-i}\) | \(339.54^{cd}\) | \(1035.68^{c-f}\) |
| 3 | CIP315010.161 | \(37.89^{c-e}\) | \(5.22^{a}\) | \(43.12^{c-e}\) | \(6.57^{d-f}\) | \(271.17^{de}\) | \(1047.64^{c-f}\) |
| 4 | CIP315003.132 | \(57.57^{a}\) | \(4.36^{a-c}\) | \(61.94^{a}\) | \(3.92^{g-i}\) | \(256.89^{de}\) | \(1440.89^{a}\) |
| 5 | CIP315004.113 | \(37.27^{c-e}\) | \(3.81^{b-d}\) | \(41.08^{c-e}\) | \(7.47^{cd}\) | \(426.77^{ab}\) | \(835.07^{f}\) |
| 6 | CIP315008.160 | \(55.18^{ab}\) | \(4.19^{a-c}\) | \(59.38^{ab}\) | \(5.93^{d-g}\) | \(341.45^{b-d}\) | \(1299.61^{a-d}\) |
| 7 | CIP315003.83 | \(35.79^{e}\) | \(2.97^{d}\) | \(38.76^{e}\) | \(10.10^{b}\) | \(222.37^{e}\) | \(968.86^{d-f}\) |
| 8 | CIP315003.166 | \(39.14^{c-e}\) | \(3.04^{d}\) | \(42.17^{c-e}\) | \(15.67^{a}\) | \(288.16^{c-e}\) | \(943.30^{ef}\) |
| 9 | CIP315003.25 | \(47.59^{a-e}\) | \(4.60^{ab}\) | \(52.19^{a-d}\) | \(3.00^{i}\) | \(260.10^{de}\) | \(1170.04^{a-e}\) |
| 10 | CIP315009.71 | \(54.92^{ab}\) | \(4.25^{a-c}\) | \(59.17^{ab}\) | \(3.25^{hi}\) | \(365.79^{bc}\) | \(1303.45^{a-c}\) |
| 11 | CIP315009.70 | \(36.42^{de}\) | \(3.28^{cd}\) | \(39.69^{de}\) | \(5.82^{d-h}\) | \(264.61^{de}\) | \(1225.58^{a-e}\) |
| 12 | CIP315008.182 | \(47.73^{a-e}\) | \(3.06^{d}\) | \(50.79^{a-e}\) | \(4.55^{e-i}\) | \(298.54^{c-e}\) | \(1194.09^{a-e}\) |
| 13 | CIP315004.13 | \(43.79^{b-e}\) | \(3.02^{d}\) | \(46.79^{b-e}\) | \(10.05^{bc}\) | \(243.17^{e}\) | \(1082.72^{b-f}\) |
| 14 | Burka | \(48.29^{a-e}\) | \(3.55^{b-d}\) | \(51.85^{a-d}\) | \(6.73^{de}\) | \(282.71^{c-e}\) | \(1392.09^{ab}\) |
| 15 | CIP315008.154 | \(48.93^{a-d}\) | \(3.35^{cd}\) | \(52.28^{a-d}\) | \(3.98^{f-i}\) | \(259.83^{de}\) | \(1270.95^{a-e}\) |
| Range | 35.79 - 57.57 | 2.95 - 4.60 | 38.76 - 61.94 | 3.00 - 15.67 | — | 835.07 - 1440.89 | |
| Mean | 46.34 | 3.66 | 49.99 | 6.48 | 304.89 | 1159.54 | |
| CV (%) | 24.34 | 26.75 | 22.47 | 34.92 | 24.37 | 24.77 | |
| p-value | < 0.01 | < 0.01 | < 0.01 | < 0.01 | < 0.01 | < 0.01 |
3.5 Potato Late Blight Severity
The progression of late blight (Phytophthora infestans) varied considerably among the evaluated potato genotypes, as demonstrated by the wide variation in the Area Under Disease Progress Curve (AUDPC). Five genotypes—CIP315003.25, CIP315009.71, CIP315003.132, CIP315008.154, and CIP315008.182—exhibited the lowest AUDPC values (ranging from 99.17 to 139.17), indicating strong field tolerance or partial resistance to the pathogen. In contrast, the remaining genotypes displayed high susceptibility, with AUDPC values peaking between 208.33 and 449.17. Notably, no genotype achieved a disease score of 1, indicating that immune vertical resistance was absent across the germplasm. A clear inverse relationship was observed between late blight severity and crop productivity; genotypes characterized by lower AUDPC scores and reduced disease severity consistently produced higher marketable tuber yields. This underscores the direct impact of foliage protection on photosynthetic capacity and subsequent dry matter partition to the tubers. Analysis of unmarketable yields further revealed distinct genotypic behaviors (Table 9). While CIP315009.30, CIP315003.83, CIP315003.166, and CIP315004.13 minimized unmarketable losses, the highest unmarketable yields were recorded for CIP315010.161, followed by the low-AUDPC lines CIP315003.25 and CIP315003.132. The elevated unmarketable yield in these latter two resistant genotypes suggests that while their foliage successfully resisted or delayed the epidemic, they may remain susceptible to tuber blight or prone to physiological defects under prolonged field conditions(Table 10).
| S/No | Genotypes | AUDPC_by_mean | Std | Reaction |
|---|---|---|---|---|
| 1 | CIP315003.25 | 99.17 | 30.97 | Resistant |
| 2 | CIP315009.71 | 112.08 | 24.31 | Resistant |
| 3 | CIP315003.132 | 114.58 | 74.07 | Resistant |
| 4 | CIP315008.154 | 130.00 | 56.32 | Resistant |
| 5 | CIP315008.182 | 139.17 | 83.15 | Resistant |
| 7 | CIP315004.61 | 157.08 | 67.22 | Moderately Resistant |
| 8 | CIP315009.30 | 167.50 | 53.06 | Moderately Resistant |
| 9 | CIP315010.161 | 189.58 | 42.88 | Moderately Resistant |
| 10 | CIP315009.70 | 190.83 | 51.54 | Moderately Resistant |
| 11 | CIP315008.160 | 193.75 | 27.56 | Moderately Resistant |
| 12 | Burka | 208.33 | 59.87 | Susceptible |
| 13 | CIP315004.113 | 240.83 | 104.85 | Susceptible |
| 14 | CIP315003.83 | 277.50 | 91.39 | Susceptible |
| 15 | CIP315004.13 | 291.25 | 139.67 | Susceptible |
| 16 | CIP315003.166 | 449.17 | 237.03 | Susceptible |
3.6 Qualitative traits of tubers
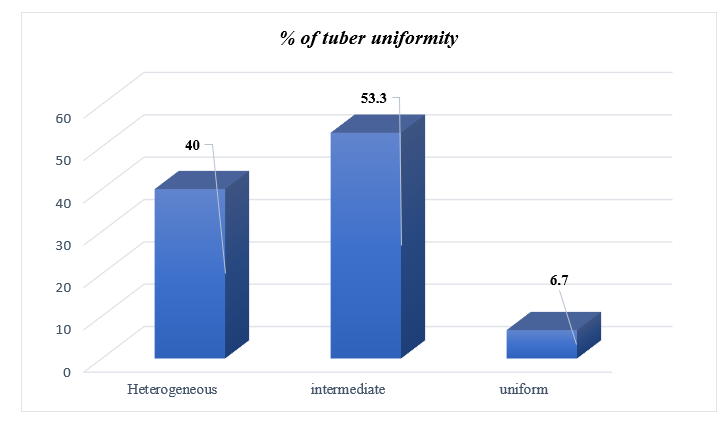
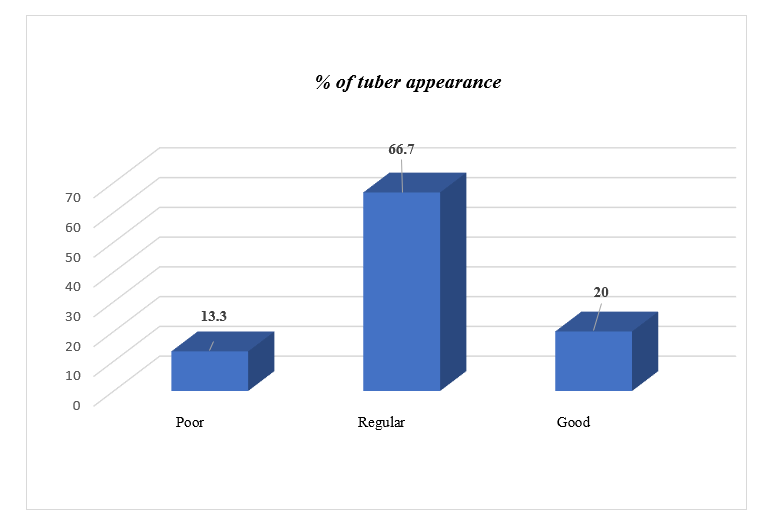
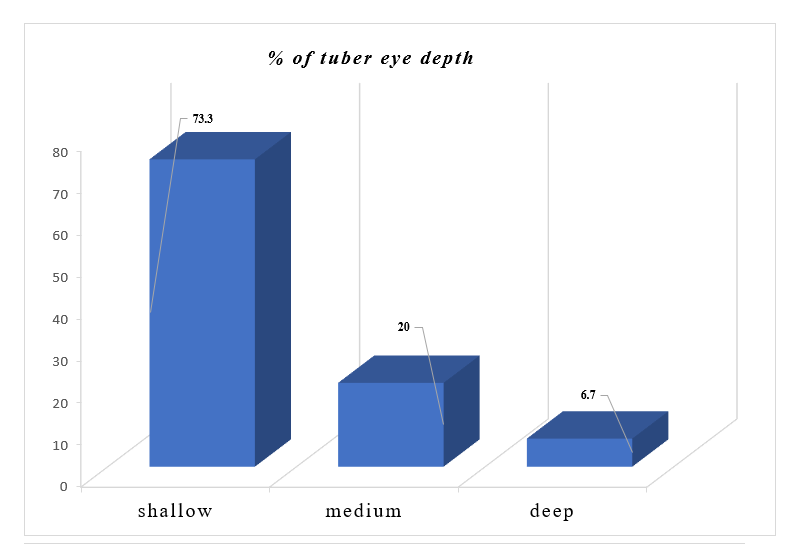
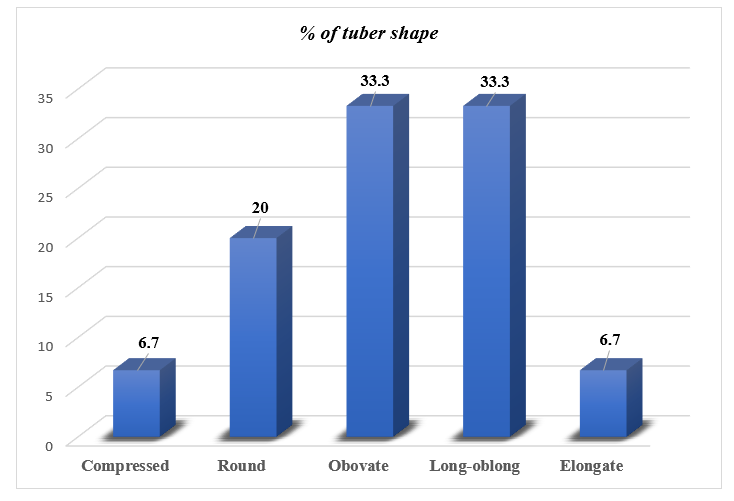
The highest proportion of genotypes had regular tuber appearance (66.7%), intermediate tuber uniformity (53.3%), shallow tuber eye depth (73.3%), obovate and long-oblong tuber shape (33.3%), dark tan chips color (37.5%) (Figure 1;Figure 2;Figure 3;Figure 4). Small proportion of genotypes had poor tuber appearance (13.3%), uniform tuber uniformity (6.7%), deep tuber eye depth (6.7%), compressed and elongate tuber shape (6.7%) (Figure 1;Figure 2;Figure 3;Figure 4).
3.7 Pearson’s correlation analysis
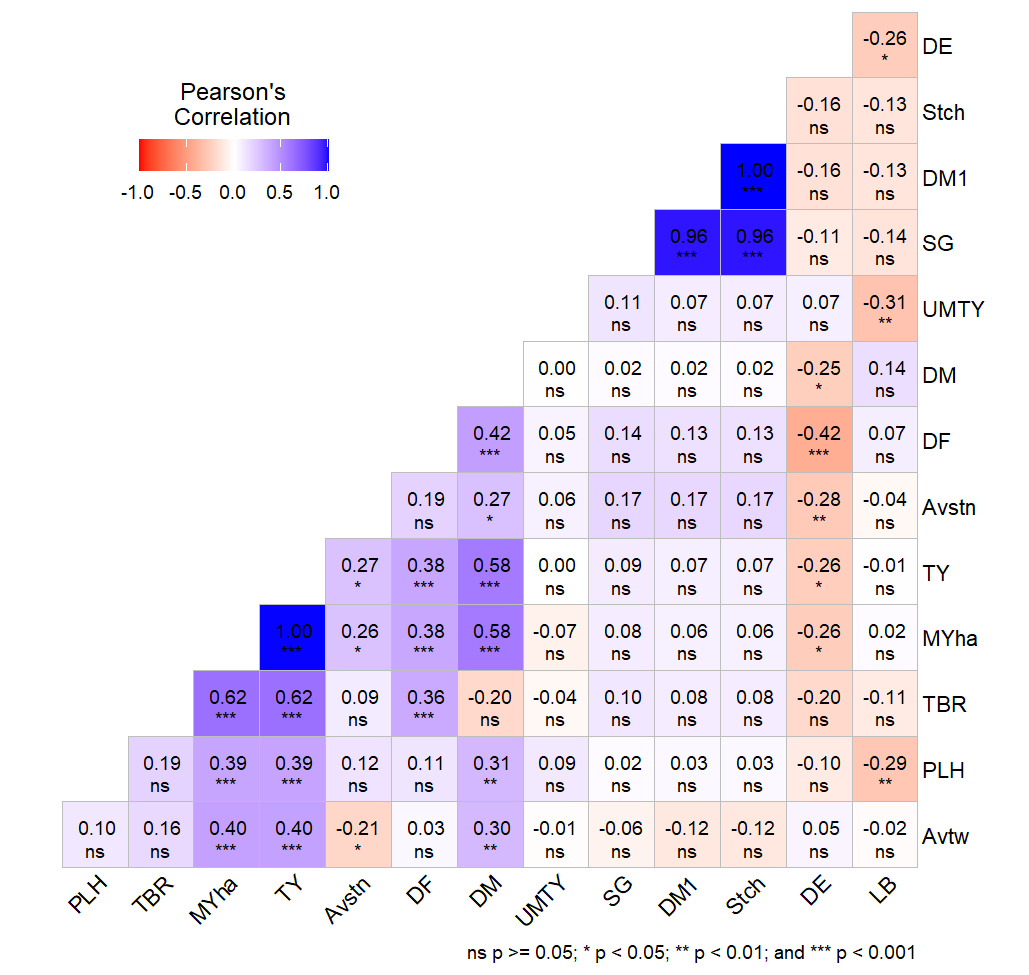
The Pearson correlation analysis revealed critical physiological and morphological determinants of potato yield and quality (Figure 5). Total tuber yield showed an absolute, highly significant positive correlation with marketable tuber yield (\(r = 1.00***\)) and showed positive correlation with tuber bulking rate (\(r = 0.62**\)). Additionally, total yield was positively associated with average tuber weight (\(r = 0.40***\)) and plant height (\(r = 0.39***\)). Collectively, these associations highlight the pivotal role of vigorous vegetative growth, prolonged or rapid bulking phases, and individual sink size (tuber weight) in driving overall volumetric productivity. Concurrently, average tuber weight exhibited a significant negative correlation with the average stem number per plant. This inverse relationship underscores a well-documented physiological trade-off: higher stem densities increase intra-plant competition and tuber set, which subsequently restricts individual tuber expansion due to limited assimilate allocation. Regarding quality attributes, exceptionally strong, positive inter-correlations were observed between total starch content, dry matter content (\(r = 0.96***\)), and specific gravity (\(r = 0.96***\)). This tight alignment confirms that specific gravity remains a highly reliable, non-destructive proxy for predicting processing quality and dry matter accumulation in this germplasm. Finally, the tuber bulking rate was positively mediated by days to 50% flowering (\(r = 0.36***\)), suggesting that a prolonged vegetative phase or optimized flowering timeline helps establish a more robust source-to-sink relationship, ultimately maximizing both marketable and total tuber yields (\(r = 0.62***\)). (Figure 5).
4 Discussion
The substantial variation in agronomic traits observed among the evaluated potato genotypes underscores the presence of high genetic diversity and varying adaptive responses to environmental conditions. In the present study, the significant differences in plant height and stem number align closely with the findings of (Chindi et al. 2021), who reported plant heights ranging from 61.48 to 74.87 cm and average stem numbers between 3.70 and 5.57. Specifically, (Chindi et al. 2021) identified Gudanie as the tallest cultivar (74.87 cm), followed by Belete (72.86 cm), while CIP-391046.14 was the shortest (61.48 cm). The pronounced differences in structural features across these genotypes are driven by a combination of inherent plant genetics, the physiological quality of seed materials, and distinct cultivar reactions to localized growing conditions (Addisu et al. 2013; Asefa et al. 2016; Eaton et al. 2017; Mohammed 2014, 2016; Mitiku et al. 2015; Tessema et al. 2020). As noted by (Singh 1973), plant height behaves as a polygenic trait that remains highly sensitive to microclimatic variables, particularly moisture availability, nutrient regimes, and solar radiation. This environmental sensitivity, alongside genetic divergence, also explains the variations in phenological traits like maturity duration. For instance, (Tsagaye et al. 2023) observed maturity periods spanning 103 to 113.33 days, whereas (Ali 2020) recorded shorter durations of 86 to 106 days. These differences highlight how planting dates, climatic shifts, and agronomic management interact with a genotype’s genetic background to alter developmental timelines.
The internal quality attributes of potato tubers, such as specific gravity, dry matter content, and total starch content, displayed varying ranges that are strongly supported by regional and global literature. The specific gravity (1.03–1.14 g/cm3), dry matter (14.86–25.65%), and starch content (9.00–20.01%) ranges highlighted by (Abbas et al. 2011) in Pakistan mirror the wide boundaries frequently observed in diverse potato germplasms. In Ethiopia, (Tesfaye et al. 2012) reported dry matter values of 17.65% to 26.70% and starch contents of 9.75% to 17.82% across Adet, Merawi, and Debretabor environments, indicating strong genotype-by-environment interactions. Similarly, (Wassu 2017) evaluated varieties across three distinct locations (Haramaya, Hirna, and Arberkete) and observed narrower but high-quality ranges for specific gravity (1.065–1.097 g/cm3), dry matter (19.49–26.98%), and starch content (10.71–16.88%). These findings are further corroborated by (Aggarwal et al. 2017), who reported comparable internal quality thresholds (specific gravity: 1.055–1.095; dry matter: 16.0–24.0%; starch: 12.25–15.20%). The variations across these studies can be attributed to environmental factors such as soil temperature, moisture stress during tuber bulking, and nutrient management, which dictate carbohydrate accumulation and translocation.
Tuber yield performance and disease tolerance also varied significantly among the genotypes. The yield ranges are comparable to those reported by (Hunde et al. 2022), where total tuber yield and marketable tuber yield ranged from 21.63 to 48.69 t/ha and 11.94 to 38.01 t/ha, respectively, with an overall mean total yield of 31.37 t/ha. This variance highlights the genetic yield potential differences among the germplasm when subjected to biotic and abiotic stresses. Biotic pressures, particularly late blight progression quantified via the Area Under the Disease Progress Curve (AUDPC), showed wide differences similar to the findings of (Kafle et al. 2024). (Kafle et al. 2024) reported a maximum AUDPC value of 2056.05, while the lowest was recorded in genotype CIP 395111.13 (695.01), signifying robust field resistance. Genotypes maintaining lower AUDPC values preserve their photosynthetic canopy longer, directly translating to higher dry matter accumulation and superior marketable yields.
Regarding external tuber characteristics, visual uniformity and physical dimensions play a vital role in consumer preference and industrial processing. (Marwaha et al. 2010) emphasized that commercially viable potato tubers should ideally display a uniform size and a round-to-oval shape. Morphological assessments by (Abbas et al. 2012) on 32 genotypes revealed a predominant frequency of white tuber skin (59.38%), oval shapes (81.25%), shallow eye depths (71.88%), and cream flesh color (65.63%). These trends align with recent data from (Seid and Tessema 2024), who observed that the highest proportion of genotypes exhibited ovate and elliptic shapes (25%) alongside shallow eyes (50%), while only a minor fraction presented compressed or obovate profiles (8.33%) and deep eye configurations (12.5%). Cultivars possessing oval shapes and shallow eyes are highly favored by processing industries as they minimize peeling losses and facilitate automated washing and slicing routines.
To systematically improve crop yield or plant structure, selection strategies must rely on character associations. These associations measure the interrelationships between various plant traits, helping breeders identify core constituent traits to target during selection (Endalkachew et al. 2020; Rahman 2015). A highly profound and consistent correlation was observed between marketable tuber yield and total tuber yield, a finding strongly supported by (Panigrahi et al. 2017), (Workayehu et al. 2021), and (Seid et al. 2025), with the latter reporting an exceptionally strong correlation coefficient (\(r = 0.98***\)). Additionally, average tuber weight emerged as a critical yield determinant, maintaining strong positive associations with both marketable and total tuber yields, as previously documented by (Rahman 2015) and (Seid et al. 2025). Interestingly, (Seid et al. 2025) also identified positive correlations between tuber starch content and yield components (marketable, total, and average yield), offering an expanded view of nutritional-yield trade-offs.
On a structural level, (Luthra et al. 2023) confirmed that average tuber weight is strongly and positively correlated with total yield (\(r = 0.8\)), while the total number of tubers scales directly with the number of tubers per plant. Beyond physical yield, character associations dictate post-harvest value. (Chindi et al. 2021) emphasized that tuber specific gravity is highly and positively correlated with dry matter content, directly influencing crisp and french fry processing quality. Higher specific gravity minimizes oil absorption during frying, improves cooking texture, and enhances recovery yields. Because these quality and yield traits are closely linked, (Ortiz et al. 2021) noted that significant trait correlations ($p ≤$0.05) provide an excellent opportunity for indirect selection. By selecting for easily measurable traits that possess high heritability, breeders can maximize genetic gains for complex targeted characteristics like total yield and processing quality simultaneously.
5 Conclusion
In conclusion, this research definitively establishes substantial genetic variation across the evaluated potato germplasm regarding tuber production dynamics, yield components, and critical processing quality traits. These findings provide plant breeders with a robust, empirically grounded selection framework tailored for developing high-yielding, premium processing-grade cultivars. Among the evaluated germplasm, genotypes CIP315004.61, CIP315009.30, CIP315003.132, CIP315009.71, and CIP315008.154 emerged as the most exceptional candidates. They demonstrate superior commercial viability by combining high yield potential with optimized internal quality attributes. Furthermore, the predominance of superficial-to-moderate eye-depth traits within these top-performing genotypes introduces a distinct architectural advantage, significantly minimizing mechanical peeling losses and streamlining post-harvest industrial processing. However, given the strong influence of environmental dynamics on polygenic agronomic traits and carbohydrate accumulation, extensive multi-location and multi-environment validation trials remain imperative. Such rigorous testing is essential to confirm agronomic stability and phenotypic plasticity before recommending these elite genotypes for wide-scale commercial cultivation or integrating them into formal breeding programs.
Artificial intelligence (AI) tools were used solely for grammatical correction and language improvement. The authors reviewed and verified all content and take full responsibility for the accuracy and integrity of the manuscript.
References
Publication Information
- Submitted: 07 September 2026
- Accepted: 21 October 2026
- Published (Online): 22 October 2026
Reviewer Information
Reviewer 1:
AnonymousReviewer 2:
Anonymous
The statements, opinions and data contained in all publications are solely those of the individual author(s) and contributor(s) and not of the publisher and/or the editor(s).
The publisher and/or the editor(s) disclaim responsibility for any injury to people or property resulting from any ideas, methods, instructions or products referred to in the content.
© Copyright (2026): Author(s). The licensee is the journal publisher. This is an Open Access article distributed under the terms of the Creative Commons Attribution-NonCommercial-NoDerivatives 4.0 International License, which permits non-commercial use, sharing, and reproduction in any medium, provided the original work is properly cited and no modifications or adaptations are made.