Assessment of Plastic Pollution and its Impact on Coastal Environment and Marine Biodiversity in the Thoothoor coastal region, Tamil Nadu, India
Plastic pollution has become a major environmental threat to coastal ecosystems, particularly in regions with intensive fishing and human activities. This study assessed the distribution, composition, and ecological impacts of plastic debris in eight coastal villages of the Thoothoor region, Tamil Nadu, India. Read more …

Plastic pollution has become a major environmental threat to coastal ecosystems, particularly in regions with intensive fishing and human activities. This study assessed the distribution, composition, and ecological impacts of plastic debris in eight coastal villages of the Thoothoor region, Tamil Nadu, India, through seasonal field surveys conducted from May 2025 to May 2026 using standardized transect and quadrat methods. A total of 365 kg of plastic waste was recorded, with Vallavilai identified as the most polluted site (23.97%), followed by Poothurai and Chinnathurai. Food wrappers, plastic fragments, and plastic bags were the dominant litter categories, while fishing ropes and nets were less abundant. Statistical analysis revealed significant differences in litter composition among plastic categories (One-way ANOVA, \(p \leq 0.001\)). Field observations also documented an Olive Ridley Sea turtle entangled in discarded fishing gear, highlighting the ecological consequences of marine debris. The findings emphasize the need for improved waste management, regular coastal monitoring, and community-based conservation initiatives to protect marine biodiversity and coastal ecosystems.
Marine litter, Anthropogenic activities, Beach debris, Rock revetment, Benthic fauna, Waste management
1 Introduction
Plastic pollution has become one of the most pressing environmental challenges of the twenty-first century, affecting terrestrial, freshwater, and marine ecosystems worldwide (Barnes et al. 2009; Rochman et al. 2013; Sivadas et al. 2021). The durability, low cost, and widespread use of plastic materials have resulted in their accumulation in the environment at unprecedented levels (Avio, Gorbi, and Regoli 2017). It is estimated that millions of tonnes of plastic waste enter the world’s oceans annually, where it persists for decades and causes adverse ecological, economic, and social impacts (Andrady 2011; Jambeck et al. 2015). Coastal regions are particularly vulnerable to plastic pollution because they receive waste from both land-based and marine-based sources, including urban runoff, tourism, fishing activities, and improper waste disposal (Cole et al. 2011; Law 2017).
Marine plastic debris occurs in various forms, including macroplastics, mesoplastics, and microplastics. These materials can accumulate on beaches, estuaries, mangroves, and nearshore waters, leading to habitat degradation and ecosystem disturbance (Moore 2008; Geyer, Jambeck, and Law 2017). Plastic waste poses significant threats to marine organisms through entanglement, ingestion, and exposure to toxic chemicals associated with plastic materials (Derraik 2002; Gregory 2009; Eriksen et al. 2014). Numerous studies have documented the presence of plastic debris in fish, seabirds, marine mammals, sea turtles, and benthic organisms, highlighting its widespread impact on marine biodiversity (Thompson et al. 2004; Gall and Thompson 2015; Wright, Thompson, and Galloway 2013; Li, Tse, and Fok 2016). The Indian coastline, extending over 7,500 km, supports diverse marine ecosystems and provides livelihood opportunities for millions of coastal communities. However, rapid coastal development, increasing population density, tourism, and inadequate waste management practices have contributed to growing levels of marine litter along the Indian coast. Plastic waste constitutes a major component of marine debris in many coastal regions of India, affecting environmental quality and ecosystem functioning (Veerasingam et al. 2020). Fishing activities also contribute substantially to plastic pollution through the disposal of damaged nets, ropes, and other synthetic materials (Li, Tse, and Fok 2016; Wright, Thompson, and Galloway 2013).
The Thoothoor coastal region was selected for the present study because it is an important dwelling place of only fishing- dependent fisherfolk community. The Thoothoor coastal region, located in Kanniyakumari District of Tamil Nadu, is one of the most important fishing zones along the southwest coast of India. The region comprises several densely populated fishing villages that depend heavily on marine resources for their livelihoods. Intensive fishing operations, coastal settlements, fish landing activities, and increasing consumer plastic usage have contributed to the accumulation of plastic waste in coastal environments. The region comprises several closely connected fishing villages, provided a suitable setting for assessing spatial variation in plastic pollution across this coastal stretch remain limited. Therefore, the Thoothoor coastal region was selected for provide baseline information on the distribution and accumulation of plastic waste and to identify areas requiring greater attention for coastal waste management and conservation. Despite the ecological and economic significance of the area, comprehensive assessments of plastic pollution and its impacts on local marine biodiversity remain limited.
Unlike earlier plastic pollution studies conducted at selected beaches and coastal locations in India, the present work concentrates on Thoothoor coastal stretch comprised multiple closely connected coastal villages consisted with full of fisherfolk. The study provides a comparative assessment of plastic accumulation across the study areas with standardized field- based observations and weight-based quantification. In addition to documenting the information regarding overall occurrence and major categories of plastics, the study identifies spatial difference in plastic accumulation and highlights potential hotspots of pollution. The study is particularly relevant because Thoothoor coast supports fisherfolk and is closely associated with marine and coastal biodiversity, while systematic information on plastic pollution across this coastal stretch is limited. Thus, the novelty of the present work lies in establishing a location-specific baseline of plastic pollution across the Thoothoor coastal region and linking the observed pollution pattern with the characteristics and anthropogenic activities of this fishing-dependent coastal environment. Understanding the extent and distribution of plastic pollution is essential for developing effective management strategies and conservation measures. Therefore, the present study aims to assess the occurrence of plastic pollution in the Thoothoor coastal region and evaluate its impacts on coastal environmental quality and marine biodiversity. The findings of this study are expected to provide baseline information for environmental monitoring, support sustainable coastal management initiatives, and contribute to ongoing efforts to reduce plastic pollution in coastal ecosystems.
2 Materials and methods
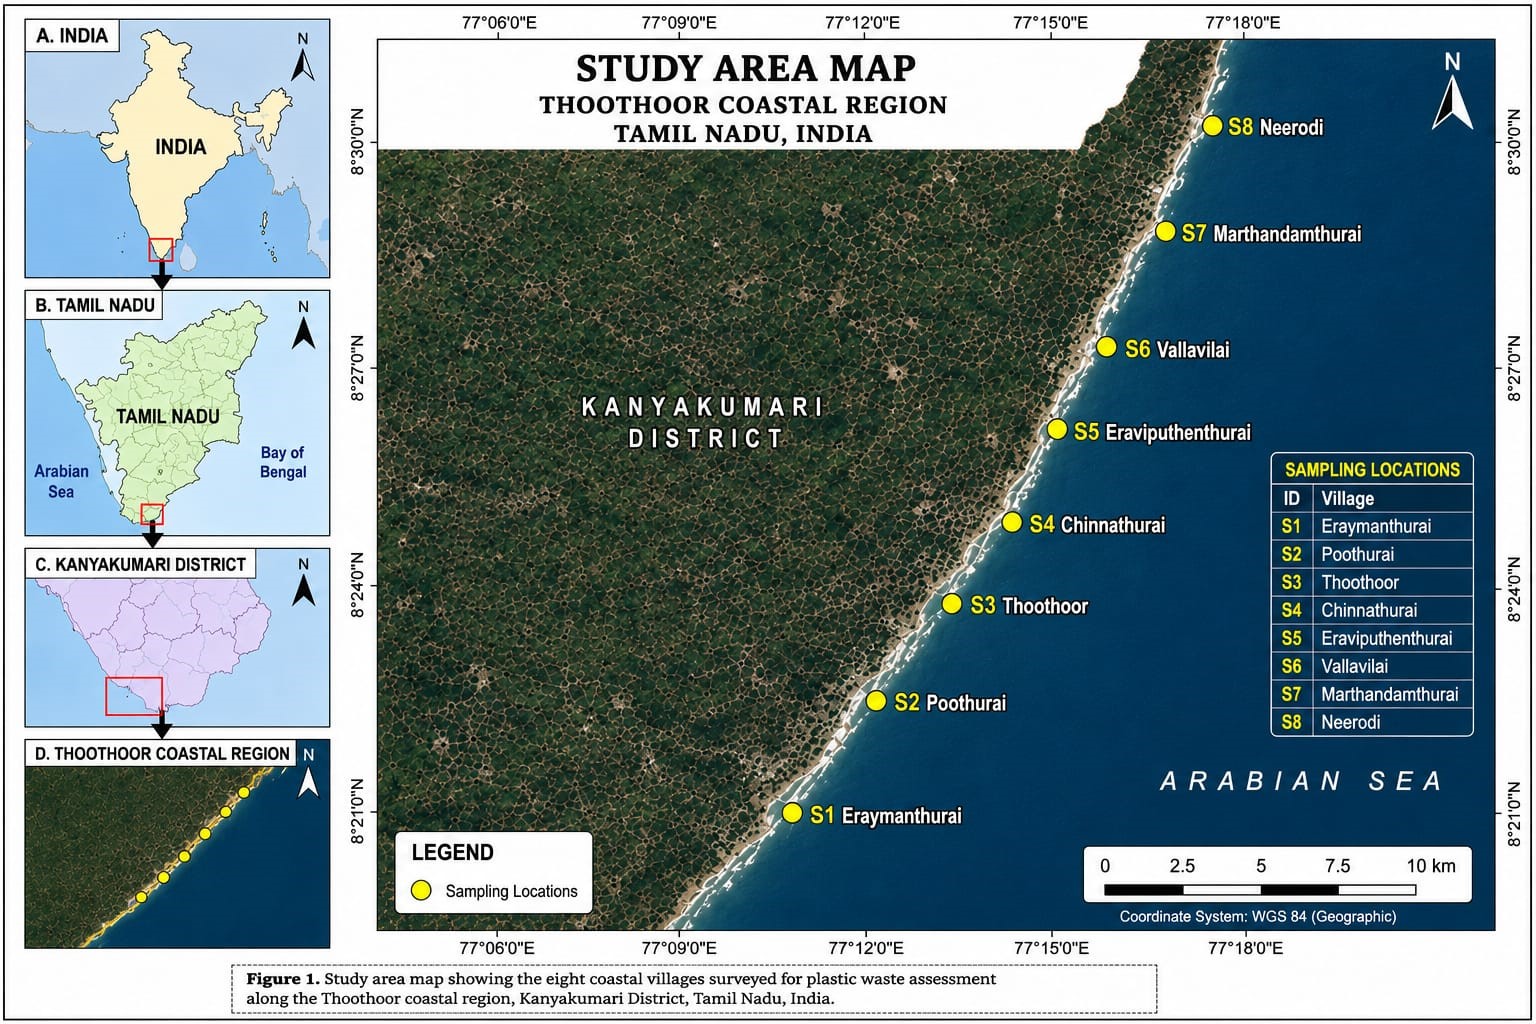
The study was conducted in the Thoothoor coastal region of Kanniyakumari District, Tamil Nadu, India, situated along the southwest coast of the Indian Peninsula. The region comprises eight major fishing villages, including Erayumanthurai, Poothurai, Thoothoor, Chinnathurai, Eraviputhenthurai, Vallavilai, Marthandamthurai and Neerodi (Figure 1). These villages are characterized by intensive fishing activities, dense coastal settlements, fish landing centers, and extensive human interaction with the marine environment.
Field surveys were during the study period from May 2025 to May 2026 and evaluated plastic waste accumulation and its distribution across the selected coastal sites. The observations were used to characterize the overall plastic pollution status of the study area rather than to make season-wise comparisons. Surveyed the abundance, composition and distribution of plastic debris along the beaches and rock revetment of selected coastal villages. Beach Litter Survey using transects and quadrats method was followed. This methodology recommended by United Nations Environment Programme and National Oceanic and Atmospheric Administration (NOAA Marine Debris Program 2013; Cheshire et al. 2009). The 12-month sampling period was selected to provide an annual baseline assessment of visible plastic accumulation across the study area. Sampling was conducted using the same standardized transect and quadrat design throughout the study period to maintain consistency in observations among the eight coastal villages. Although, long-term multi-year monitoring would be required to evaluate interannual variability and long-term trends in plastic accumulation.
Eraymanthurai (8.2446721˚N,77.1634660˚E) was selected as first sampling site followed by Poothurai (8.2552276˚N,77.1488142˚E) was the second; Thoothoor (8.259272˚N,77.142498˚E) the third, Chinnathurai (8.262057˚N,77.138643˚E) the fourth; Eraviputhenthurai (8.265202 ˚N,77.134448 ˚E) the fifth; Vallavilai (8.279609˚N,77.114747˚E) the sixth; Marthandamthurai (8.286673˚N,77.105137˚E) the seventh and Neerodi (8.290602˚N,77.100036˚E) the eighth. The transact and quadrats method of sampling was done between the intertidal regions and rock revetment of all sampling sites. The study area comprised two distinct coastal habitats, namely sandy beach and rock-revetment areas. Plastic waste observations from these habitats were recorded separately to account for differences in substrate characteristics, wave exposure, and potential plastic accumulation patterns. Beach and rock-revetment observations were therefore considered as separate habitat categories during field assessment and interpretation.
To ensure comparability among eight coastal villages, an identical sampling design was adopted at all sites. Each village was surveyed using two transects, within which 20 quadrats of equal dimensions were examined. Plastic litter collected from all quadrats at each site was weighed and expressed as the total mass (Kg). Because the number of transects, quadrats, quadrat size, and sampling effort were identical across all study sites, comparison of plastic waste among villages were based on standardized sampling effort, thereby minimizing bias arising from differences in survey intensity.
The intertidal regions of sampling sites are sandy in nature and it is located between the high tide and low tide marks. It is alternatively exposed during low tide and submerged during high tide. This environment is influenced by tidal cycles, wave actions and currents which transport and deposit plastic litter along with marine debris. The sandy substrate provides an important habitat for a variety of benthic organisms and serves as a key zone for monitoring the accumulation and distribution of coastal plastic pollution. In the present study, the sandy intertidal zone at each sampling site was surveyed using standardized transect and quadrat methods to quantify the abundance and composition of plastic litter. To this, laid a 100 m transect parallel to the sandy shore line (from high tide line to waterline). Marked the start and end points with the help of a measuring tape. Then, divided as quadrats of 1 m × 1 m at a regular intervals of every 10 m. Every beach had 10 quadrats within the 100 m transect. A total of 80 quadrats exhibited altogether the beaches of eight study area. To ensure systematic spatial coverage within the selected beach section, quadrats were positioned at regular 10 m intervals along the 100 m transect, thereby providing evenly distributed sampling points from the high-tide line toward the waterline. The same sampling design and effort were maintained across all eight coastal villages to facilitate standardized comparison of plastic accumulation. Eraymanthurai beach quadrats are Ery-Q1, Ery-Q2, Ery-Q3, Ery-Q4, Ery-Q5, Ery-Q6, Ery-Q7, Ery-Q8, Ery-Q9 and Ery-Q10. Poothurai quadrats are Poo-Q1, Poo-Q2, Poo-Q3, Poo-Q4, Poo-Q5, Poo-Q6, Poo-Q7, Poo-Q8, Poo-Q9 and Poo-Q10. Thoothoor quadrats are Too-Q1, Too-Q2, Too-Q3, Too-Q4, Too-Q5, Too-Q6, Too-Q7, Too-Q8, Too-Q9, Too-Q10. Chinnathurai quadrats are Chi-Q1, Chi-Q2, Chi-Q3, Chi-Q4, Chi-Q5, Chi-Q6, Chi-Q7, Chi-Q8, Chi-Q9, Chi-Q10. Eraviputhenthurai quadrats are Ept-Q1, Ept-Q2, Ept-Q3, Ept-Q4, Ept-Q5, Ept-Q6, Ept-Q7, Ept-Q8, Ept-Q9 and Ept-Q10. Vallavilai quadrat are Val-Q1, Val-Q2, Val-Q3, Val-Q4, Val-Q5, Val-Q6, Val-Q7, Val-Q8, Val-Q9 and Val-Q10. Marthandamthurai quadrats are Mar-Q1, Mar-Q2, Mar-Q3, Mar-Q4, Mar-Q5, Mar-Q6, Mar-Q7, Mar-Q8, Mar-Q9 and Mar-Q10. Neerodi quadrat are Nee-Q1, Nee-Q2, Nee-Q3, Nee-Q4, Nee-Q5, Nee-Q6, Nee-Q7, Nee-Q8, Nee-Q9 and Nee-Q10.
The rock revetments are sloping coastal defence walls made of large natural armour stones that are placed along the coast to dissipate wave energy and prevent coastal erosion․ Other purposes of rock revetments include protecting infrastructure and fishing grounds near the shoreline․ The structure of the rocks creates gaps into which floating debris collects․ Rock revetments have been found to trap plastic fishing nets‚ ropes‚ plastic bottles and bags‚ food wrappers and plastic debris․ At each sampling location‚ the rock revetment was sampled using a standard 100m transect‚ with 1m × 1m quadrats placed at regular intervals along the transect‚ to characterize the abundance‚ composition and distribution of visible surface plastic debris trapped on and between the rocks․ Every rock revetment has 10 quadrats within the 100 m transect. A total of 80 quadrats exhibited altogether in the rock revetment of eight study area. Eraymanthurai rock revetment quadrats are Ery-Q11, Ery-Q12, Ery-Q13, Ery-Q14, Ery-Q15, Ery-Q16, Ery-Q17, Ery-Q18, Ery-Q19 and Ery-Q20. Poothurai quadrat are Poo-Q11, Poo-Q12, Poo-Q13, Poo-Q14, Poo-Q15, Poo-Q16, Poo-Q17, Poo-Q18, Poo-Q19 and Poo-Q20. Thoothoor quadrat are Too-Q11, Too-Q12, Too-Q13, Too-Q14, Too-Q15, Too-Q16, Too-Q17, Too-Q18, Too-Q19 and Too-Q20. Chinnathurai quadrat are Chi-Q11, Chi-Q12, Chi-Q13, Chi-Q14, Chi-Q15, Chi-Q16, Chi-Q17, Chi-Q18, Chi-Q19 and Chi-Q20. Eraviputhenthurai quadrat are Ept-Q11, Ept-Q12, Ept-Q13, Ept-Q14, Ept-Q15, Ept-Q16, Ept-Q17, Ept-Q18, Ept-Q19 and Ept-Q20. Vallavilai quadrat are Val-Q11, Val-Q12, Val-Q13, Val-Q14, Val-Q15, Val-Q16, Val-Q17, Val-Q18, Val-Q19 and Val-Q20. Marthandamthurai quadrat are Mar-Q11, Mar-Q12, Mar-Q13, Mar-Q14, Mar-Q15, Mar-Q16, Mar-Q17, Mar-Q18, Mar-Q19 and Mar-Q20. Neerodi quadrat are Nee-Q11, Nee-Q12, Nee-Q13, Nee-Q14, Nee-Q15, Nee-Q16, Nee-Q17, Nee-Q18, Nee-Q19 and Nee-Q20.
All the visible plastic debris present within each quadrat was identified and classified based on to its type and size. The size categories based on its longest dimension. Plastic items are larger than 25 mm were classified as macroplastics and plastic items measuring 5-25 mm were classified as mesoplastic, and items smaller than 5 mm were classified as microplastics (Cheshire et al. 2009; NOAA Marine Debris Program 2013). In the present study found only macroplastics and mesoplastics. Microplastics (˂5 mm) not included because they require laboratory for sampling and analysis. Each plastic object was counted as one item, regardless of its size and or weight. Plastic litter was identified and categorized into different types including plastic bags, plastic bottles, food wrappers, fishing ropes, fishing nets, plastic containers, sachets, bottle caps, and plastic fragments.
The number of items in each category was counted, and total weight of each quadrat was measured using a digital weighing balance. The quantity of plastic waste present at each site was estimated based on observations of quadrats and expressed as mean and percentage of total plastic weight (kg). The mean plastic waste for each village was calculated as:
\[ \mathrm{Mean\ plastic\ waste\ (kg)} = \frac{\sum_{i=1}^{n} W_i}{n} \]
where Wi represents the plastic waste weight (kg) recorded in each sampling unit and n represents the total number of sampling units assessed within the respective village.
The percentage contribution of each village was calculated as:
\[ \mathrm{Percentage\ contribution\ (\%)} = \frac{M_i}{\sum_{i=1}^{n} M_i} \times 100 \]
where Mi represents the mean plastic waste (kg) of the respective village and ΣMi represents the sum of the mean plastic waste values across all eight villages.
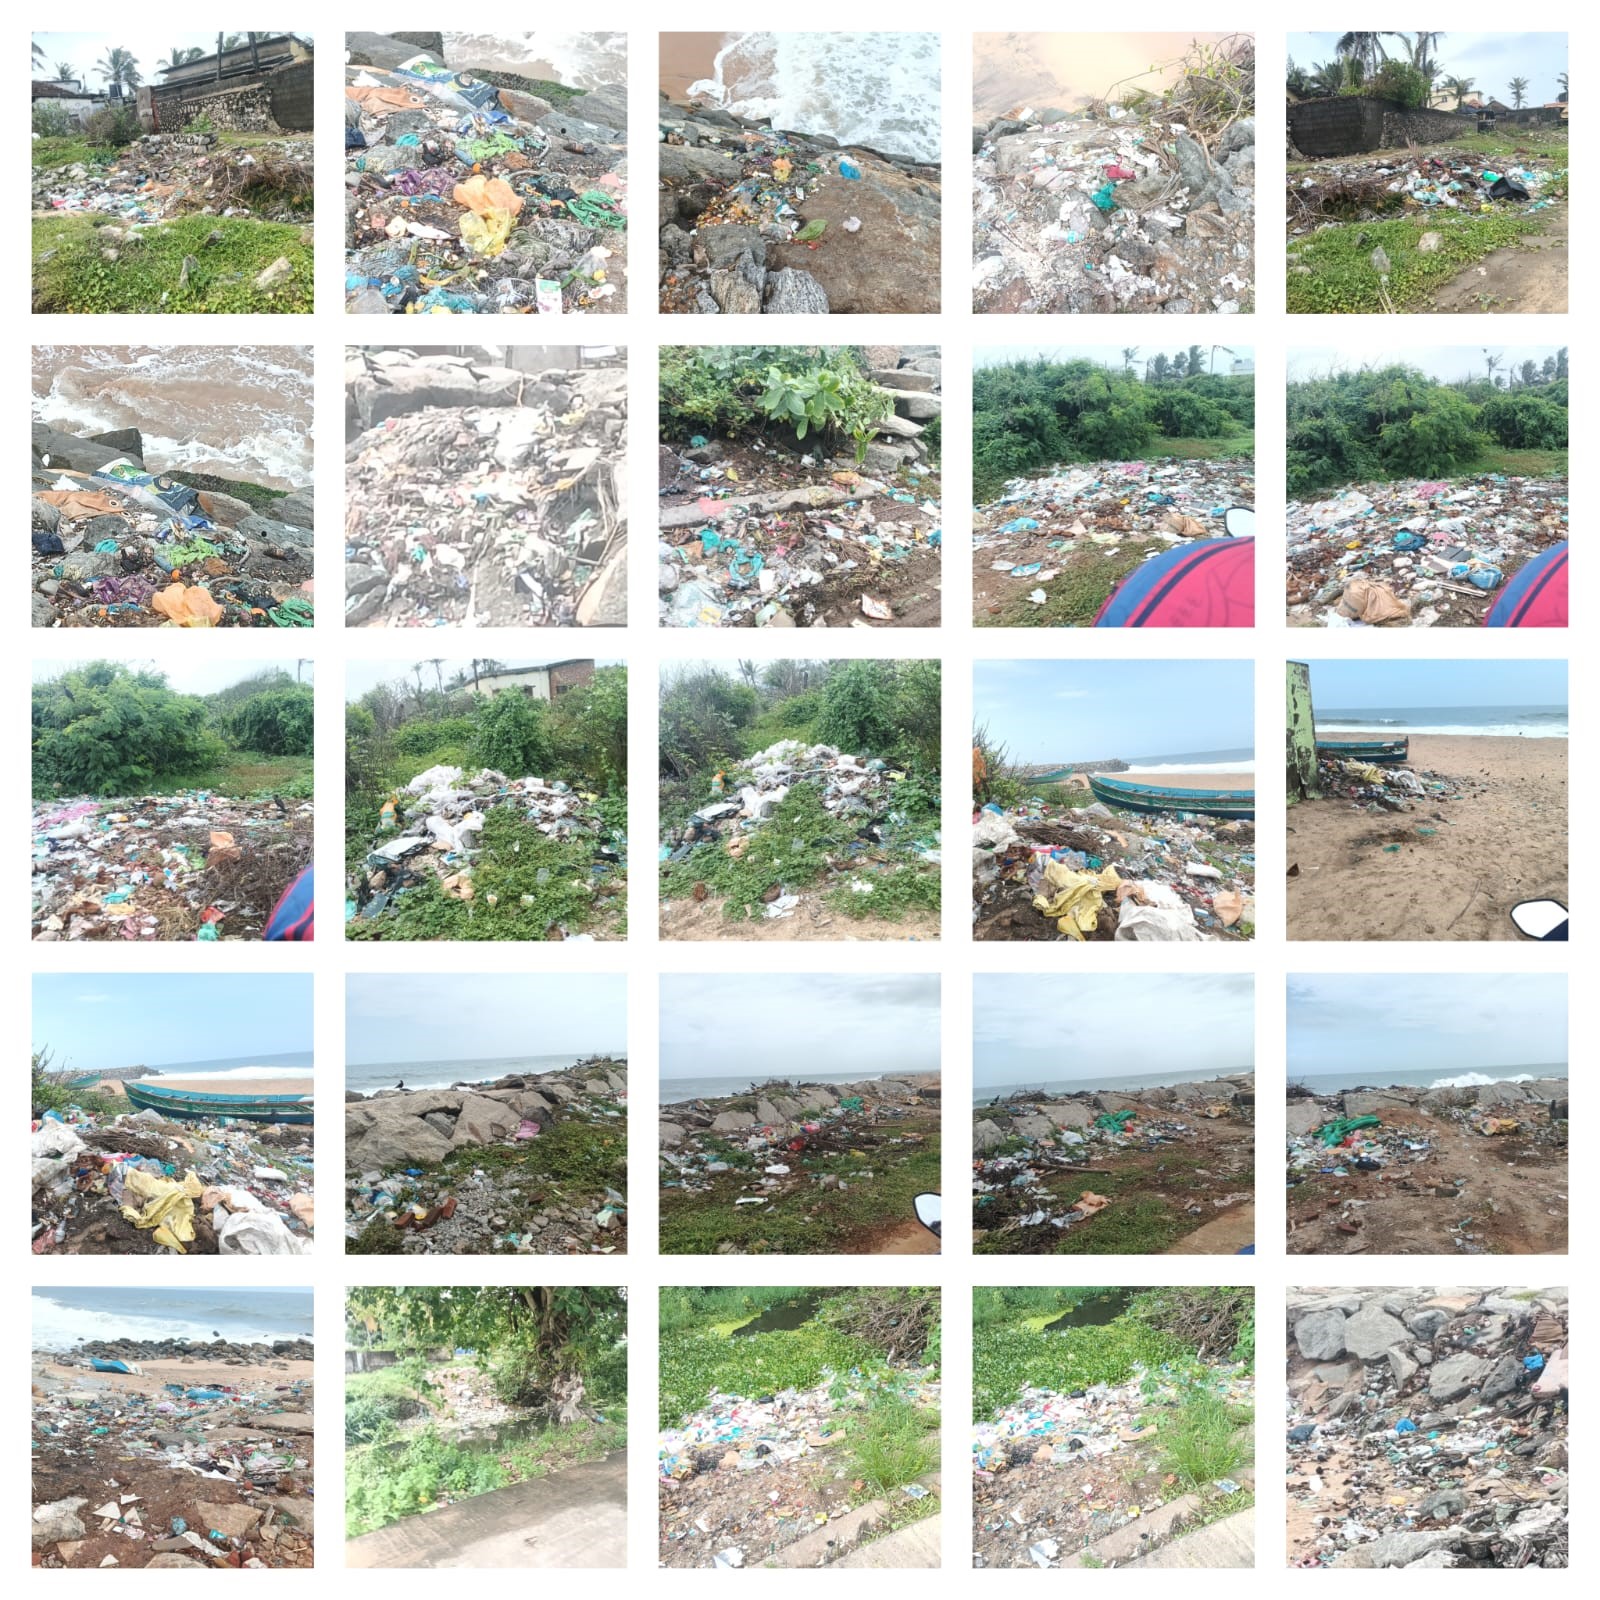
The estimated quantity of accumulated plastic waste was catagorized into six headings: Low (at Neerodi with 7.5 kg), Moderate (at Marthandamthurai with 12.5 kg); Moderate-high (at Eraymanthurai with 37.5 kg), High (between Thoothoor and Eraviputhenthurai respectively with 47.5 and 50 kg), Very high (between Chinnathurai and Poothurai respectively with 60 and 62.5 kg), Huge (at Vallavilai with 87.5 kg). The recorded values were used to compare pollution intensity among the surveyed villages. Photographic documentation was also carried out during the survey to record the nature and distribution of plastic debris. The collected information was subsequently used to evaluate the extent of plastic pollution and its potential impact on the coastal environment and marine biodiversity of the study area.
Statistical analyses were performed using RStudio (Version 4.0). Evaluated the differences in the amount of marine litter among the nine categories using one-way analysis of variance (One-way ANOVA). Before conducting ANOVA, checked the assumptions of normality and homogeneity of variances using the Shapiro–Wilk test and Levene’s test, respectively. Since the assumptions were not met, also conducted a Kruskal–Wallis test to verify the significance of the results using a non-parametric approach. When found significant differences, and applied Tukey’s Honestly Significant Difference (HSD) post hoc test to determine which litter categories differed significantly. The treatment effect size was estimated using eta-squared (\(\eta^2\)), and accepted statistical significance at \(p \leq 0.05\).
A single observation of a dead Olive Ridley Sea turtle was observed in field survey. The turtle was identified based on morphometric and meristic characteristics. The turtle entangled in a discarded fishing net around its neck, flippers, and body. A single observation cannot by itself support a definitive conclusion about the overall impact of plastic pollution on marine biodiversity. However, the observation of an Olive Ridley turtle entangled in discarded fishing gear provides an important initial field indication of a potential threat to marine biodiversity in the study area. Therefore, this observation is presented as evidence of a possible ecological impact rather than as evidence of a population-level effect. Further systematic and long-term monitoring would be necessary to determine the frequency, severity, and broader consequences of plastic-related entanglement on marine biodiversity.
3 Result
Table 1 and Figure 3 illustrates the percentage contribution of plastic waste recorded from eight coastal villages, with a total collected plastic waste of 365 kg. Among all surveyed villages, Vallavilai contributed the huge amount of plastic waste (87.5 kg; 23.97%), indicating that this area is the most significant plastic polluted site in the study region. The high waste accumulation may be associated with intense fishing activities, higher population density, and improper disposal of plastic materials. Poothurai and Chinnathurai were the second and third largest contributors, accounting for 62.5 kg (17.12%) and 60.0 kg (16.44%), respectively. These villages together contributed more than one-third of the total plastic waste, highlighting substantial anthropogenic pressure along their coastlines. High levels of plastic waste were observed in Eraviputhenthurai (50.0 kg; 13.70%) and Thoothoor (47.5 kg; 13.01%), suggesting continuous input of plastic debris from fishing, tourism, and domestic activities. Eraymanthurai contributed 37.5 kg (10.27%), indicating a comparatively moderate-high but still notable level of plastic contamination.
The moderate contributions were recorded in Marthandathurai (12.5 kg; 3.42%) and low level at Neerodi (7.5 kg; 2.05%). When compare with other sites, Marthandathurai and Neerodi villages suggesting relatively better waste management practices or lower anthropogenic activities. Overall, the results reveal an uneven spatial distribution of plastic pollution across the Thoothoor coastal region, with Vallavilai, Poothurai, and Chinnathurai emerging as major pollution hotspots. The top three villages (Vallavilai, Poothurai, and Chinnathurai) together account for 57.53% of the total plastic waste recorded in the study area, demonstrating that plastic pollution is concentrated in a few critical locations.
| Village | Mean Plastic Wastage (Kg) | Percentage Contribution (%) | Pollution Category |
|---|---|---|---|
| Eraymanthurai | 37.5 | 10.70 | Moderate-High |
| Poothurai | 62.5 | 17.20 | Very High |
| Thoothoor | 47.5 | 13.01 | High |
| Chinnathurai | 60.0 | 16.44 | Very High |
| Eraviputhenthurai | 50.0 | 13.70 | High |
| Vallavilai | 87.5 | 23.97 | Very High |
| Marthandathurai | 12.5 | 3.42 | Moderate |
| Neerodi | 7.5 | 2.05 | Low |
| Total | 365.0 | 100.00 | - |
The mean plastic waste values across the eight coastal villages ranged from 7.5 kg in Neerodi to 87.5 kg in Vallavilai. The sum of the village-level mean values was 365.0 kg, which represents the aggregate of the calculated village means and should not be interpreted as the total quantity of plastic waste collected from all sampling units.
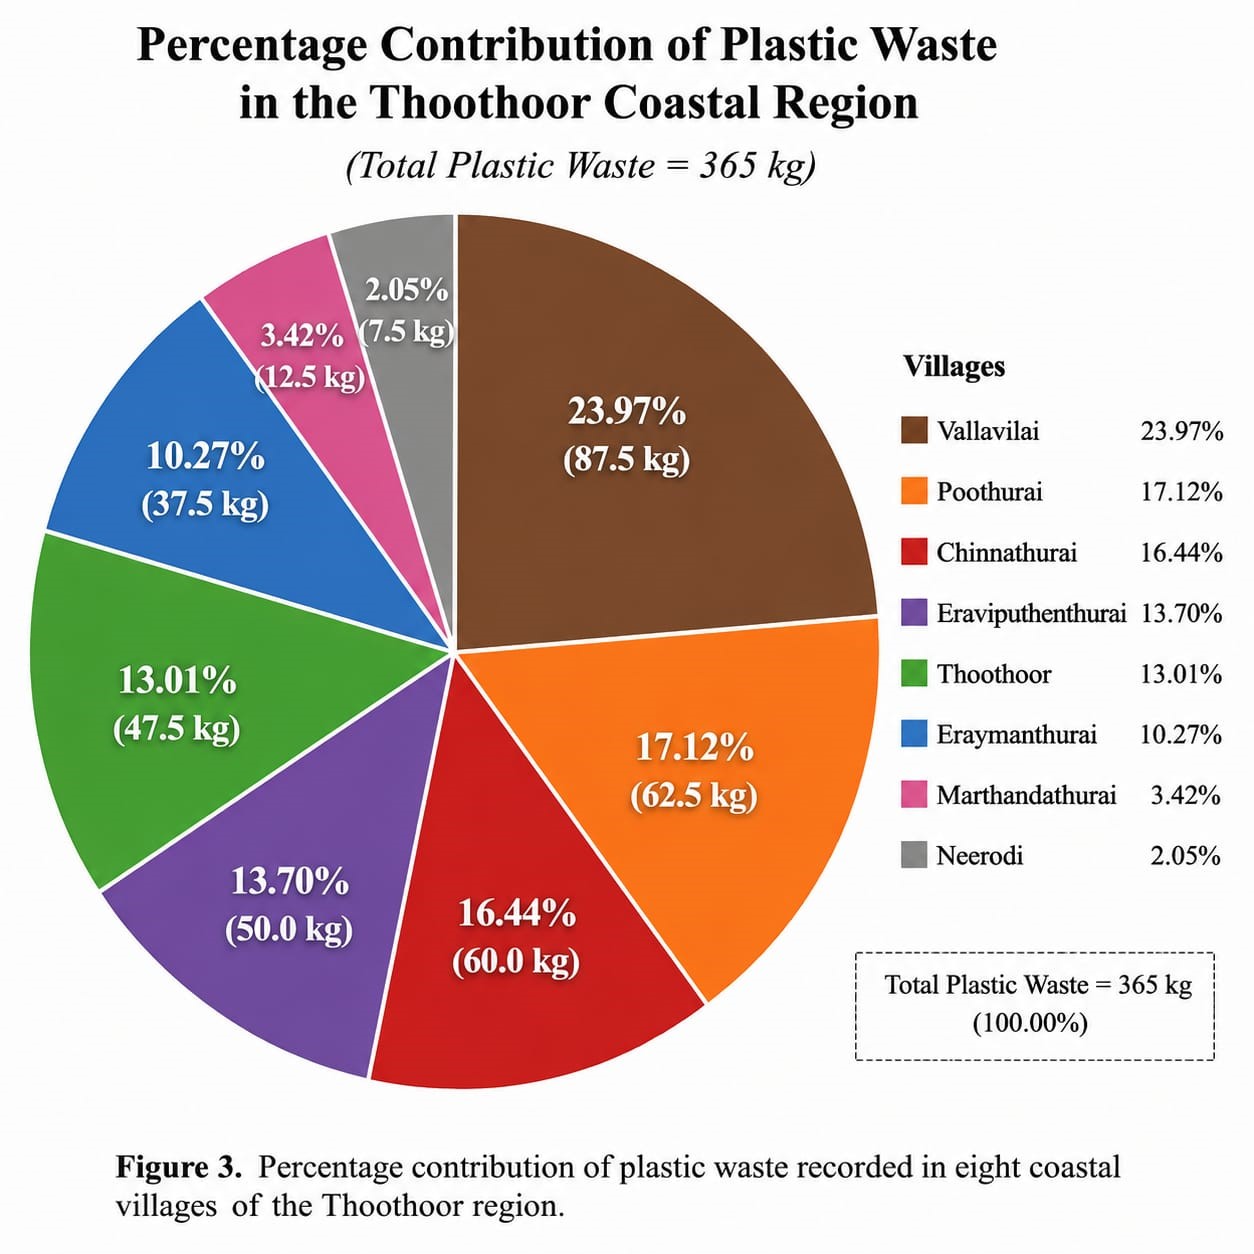
Figure 4 illustrates the mean (± SE) abundance of different plastic litter catogories were recorded along the surveyed coastal villages. Food wrappers found highest mean litter count, followed by plastic fragments and plastic bags, indicating that the single use plastic items were the dominant components of coastal litter. Sachets ranked fourth in abundance, while bottle caps showed a moderate mean count. Plastic bottles and plastic containers were comparatively less abundant. Fishing ropes and fishing nets recorded the lowest mean litter counts, suggesting that fisheries related plastic debris contributed less to the total litter load than consumer derived plastic waste. While capturing the fishes, the damaged gears and ropes may throw directly to the sea where the fisherfolk fishing in the sea. The relatively small standard error bars indicate limited variation in the abundance of each litter category among the sampling quadrants.
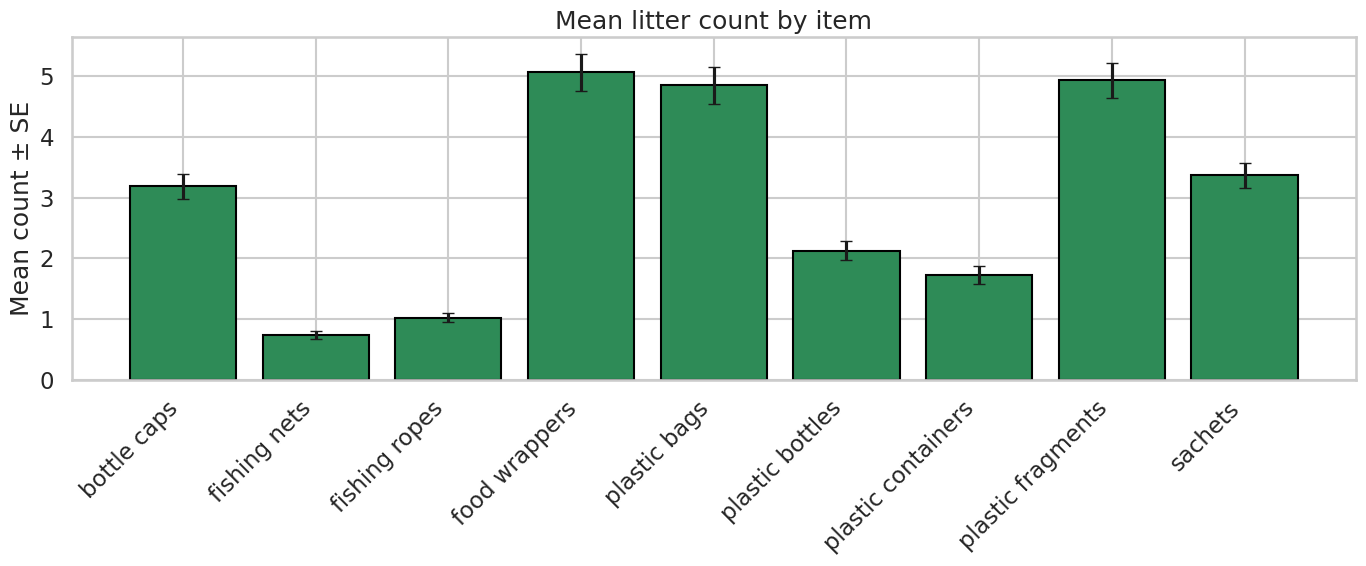
Counts of marine litter differed significantly among litter categories. A one-way ANOVA revealed a strong effect of item type on litter abundance, F(8, 1431) = 62.94, \(p \leq 0.001\), \(\eta^2\) = 0.260. Diagnostic checks indicated that residuals departed from normality (Shapiro–Wilk W = 0.945, \(p \leq 0.001\)) and that variances were heterogeneous among groups (Levene’s test F = 47.95, \(p \leq 0.001\)). A Kruskal–Wallis test confirmed the pattern independently of parametric assumptions (H = 406.47, \(p \leq 0.001\)). Tukey’s HSD comparisons showed that food wrappers, plastic bags, and plastic fragments were among the most abundant litter types, whereas fishing nets and fishing ropes had the lowest counts.
The mean differences between the nine litter types were statistically significant (One-way ANOVA, F(8, 1431) = 62.94, \(p \leq 0.001\), \(\eta^2\) = 0.260) which indicates that the type of litter affected the quantity of litter items collected. The most common type of litter included food wrappers, plastic fragments, plastic bags, sachets, bottle caps, plastic bottles, plastic containers, fishing ropes, and finally fishing nets – the least frequent category of litter. Although the assumptions of normality (Shapiro-Wilk W = 0.945, \(p \leq 0.001\)) and equal variance (Levene’s test F = 47.95, \(p \leq 0.001\)) were violated based on the diagnostic test results, significant differences between litter categories still existed based on the Kruskal-Wallis test (H = 406.47, \(p \leq 0.001\)). Significant differences between litter categories were identified using Tukey’s HSD post hoc comparisons.
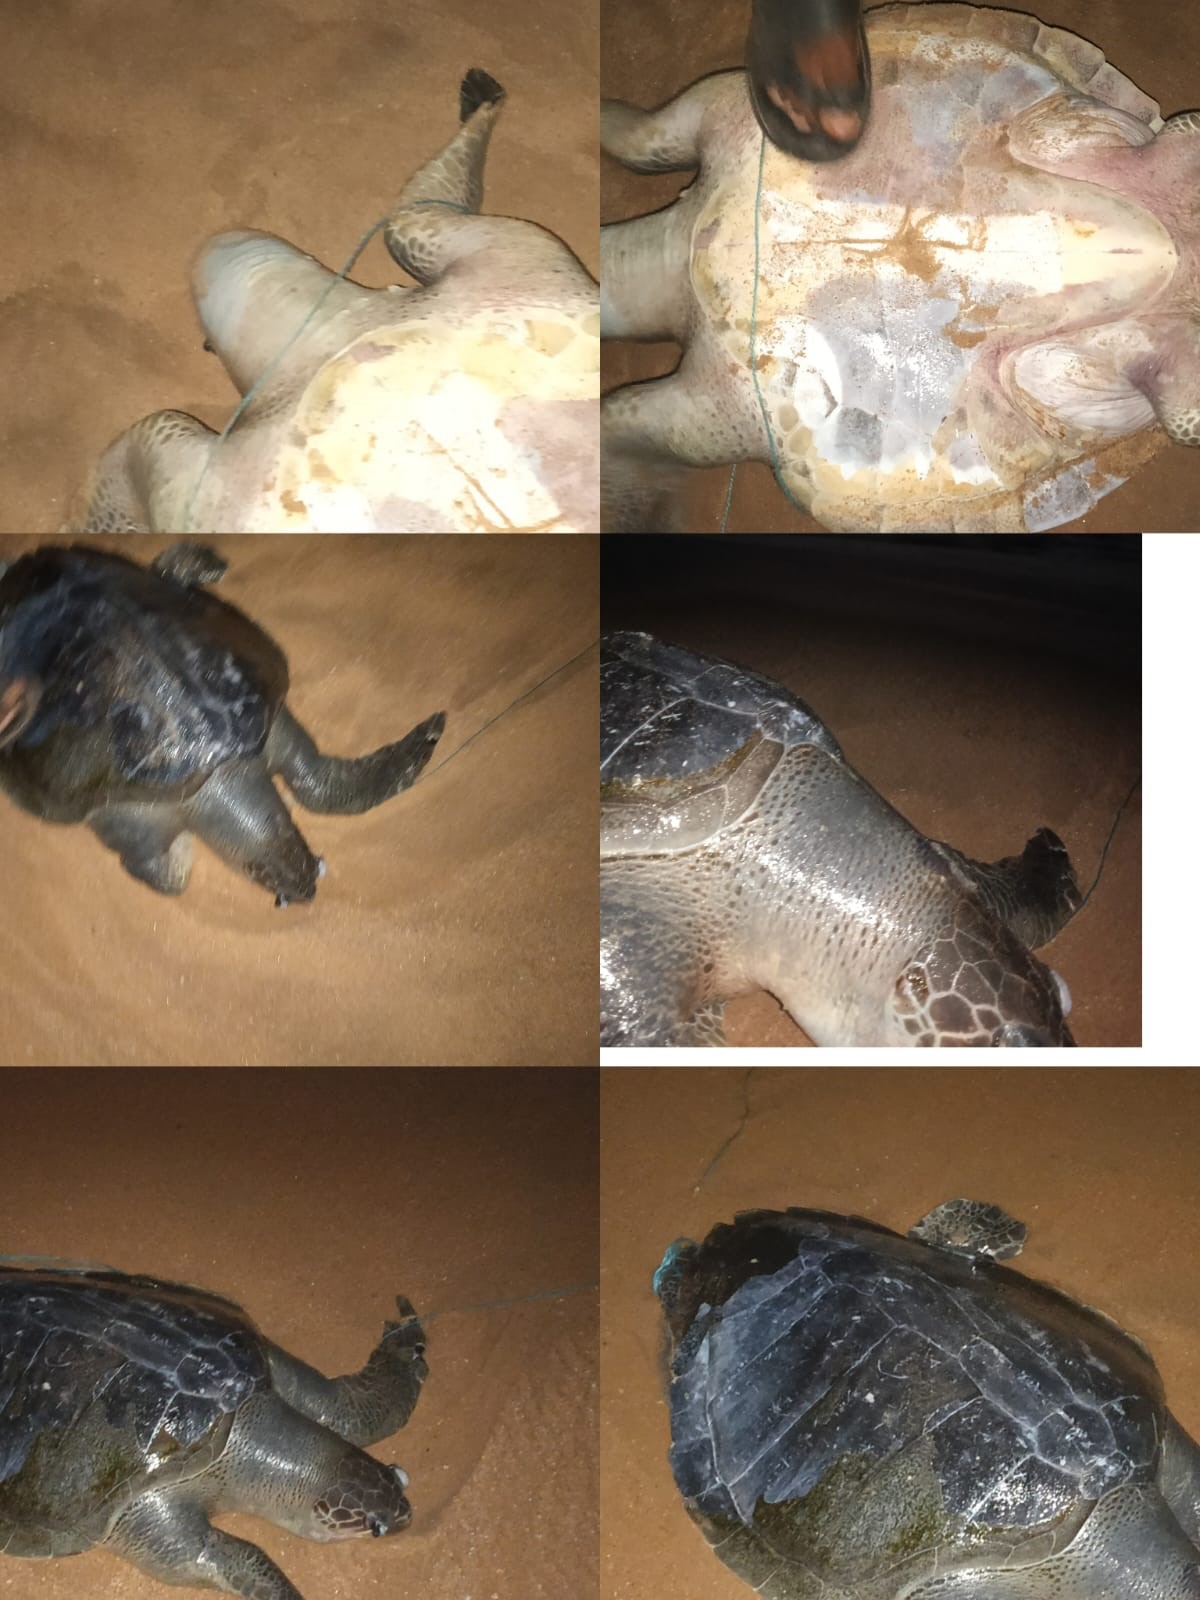
In addition to the analysis of litter quantity, a dead Olive Ridley Sea turtle (Lepidochelys olivacea) was observed during the field survey. The turtle was entangled in a discarded fishing net around its neck, flippers, and body (Figure 5), demonstrating the harmful effects of abandoned fishing gear on marine wildlife (Gall and Thompson 2015; Wright, Thompson, and Galloway 2013).
During field observations, numerous plastic items were found buried beneath the sandy substrate. Buried plastic debris may interfere with the normal burrowing behaviour of mole crabs. Over time, plastic materials degrade into microplastics, which may be accidentally ingested by mole crabs during filter feeding (Cole et al. 2011; Wright, Thompson, and Galloway 2013). The ingestion of microplastics may reduce feeding efficiency, impair growth, and facilitate the transfer of plastic particles through the marine food web (Cole et al. 2011; Wright, Thompson, and Galloway 2013). Since mole crabs are consumed by local fishing communities, there is a potential pathway for microplastics to reach humans (Avio, Gorbi, and Regoli 2017; Law 2017).
Plastic bags and other debris trapped between rock revetments often cover edible seaweeds, reducing light penetration and affecting their growth. Over time, these plastics fragment into microplastics, which may be ingested by herbivorous fishes while grazing on algae (Cole et al. 2011; Wright, Thompson, and Galloway 2013). Planktivorous fishes may also ingest microplastics suspended in the water column along with plankton (Cole et al. 2011; Law 2017). Consequently, microplastics may be transferred through the food chain to humans via seafood consumption (Avio, Gorbi, and Regoli 2017; Li, Tse, and Fok 2016). Plastic debris trapped between rock revetments may also provide an artificial substrate for the settlement of mussel spat. Mussels attached to plastic materials may continue to grow while remaining on these artificial surfaces, highlighting another potential ecological impact of coastal plastic pollution (Barnes et al. 2009; Gregory 2009).
4 Discussions
A total estimated plastic waste load of 365 kg was recorded across the eight surveyed coastal villages. Vallavilai exhibited the highest plastic waste accumulation (87.5 kg), accounting for 23.97% of the total waste recorded. This was followed by Poothurai (62.5 kg; 17.12%) and Chinnathurai (60.0 kg; 16.44%). In contrast, Neerodi (7.5 kg; 2.05%) and Marthandathurai (12.5 kg; 3.42%) recorded the lowest levels of plastic pollution.
Based on the observed waste loads, Vallavilai was categorized as a very high pollution hotspot, while Poothurai and Chinnathurai were classified as high pollution zones. Moderate levels of plastic pollution were observed in Eraviputhenthurai, Thoothoor, and Eraymanthurai. The spatial variation in plastic waste distribution suggests that fishing intensity, population density, tourism activities, and waste disposal practices may influence the accumulation of plastic debris along the coast (Jambeck et al. 2015; Law 2017).
The present study demonstrated that plastic pollution is prevalent across all surveyed villages of the Thoothoor coastal region, indicating that marine litter has become a significant environmental concern along the southwest coast of Tamil Nadu. The variation in plastic accumulation among villages suggests that local human activities, particularly fishing operations, coastal settlements, and waste disposal practices, strongly influence the distribution of plastic debris (Barnes et al. 2009; Li, Tse, and Fok 2016).
The higher plastic accumulation observed in Vallavilai and other heavily populated fishing villages may be associated with intensive fishing activities and greater anthropogenic pressure. Fishing-related materials such as ropes, nets, packaging materials, and plastic containers are commonly reported as major contributors to coastal plastic pollution worldwide. Similar observations have been reported in coastal ecosystems where fishing and maritime activities contribute substantially to marine debris accumulation (Derraik 2002; Gregory 2009; Li, Tse, and Fok 2016).
Plastic debris poses serious ecological risks to marine organisms through entanglement and ingestion (Derraik 2002; Gall and Thompson 2015; Wright, Thompson, and Galloway 2013). During the present study, a dead Olive Ridley Sea turtle (Lepidochelys olivacea) was observed with its neck, flippers, and body tightly entangled in a discarded fishing net, demonstrating the direct impact of abandoned, lost, or discarded fishing gear on marine wildlife. Entanglement restricts movement, prevents normal swimming and feeding, and may result in severe injury, drowning, or death (Gall and Thompson 2015; Wright, Thompson, and Galloway 2013). Discarded fishing nets and ropes that accumulate along the Thoothoor coast continue to pose a significant threat to marine fauna. Large marine vertebrates, including sea turtles, dugongs (sea cows), and seals that occasionally occur in coastal waters, are also vulnerable to entanglement. Such interactions can cause physical injuries, impaired mobility, reduced foraging efficiency, and mortality (Gall and Thompson 2015). These findings emphasize the importance of proper disposal and retrieval of unwanted fishing gear to reduce the ecological impacts of marine plastic pollution and protect vulnerable marine species.
The Thoothoor coast has a sandy shoreline. During field observations, many plastic items, especially plastic covers and fragments, were found embedded below the sand surface. It interferes with normal burrowing of mole crabs. Buried plastics can change the physical properties of sand. They can affect soil aeration, water flow, and the structure of the sediment. The movement of water through the sand is altered when plastics buried into the sand. This reduces the number of plankton and organic particles reaching mole crabs during wave wash. It is a filter feeder and it ingest microplastics along with plankton (Cole et al. 2011; Wright, Thompson, and Galloway 2013). Since local fishing communities harvest and eat sand crabs, there is a risk of microplastics moving up the food chain to humans (Avio, Gorbi, and Regoli 2017; Law 2017).
Over time, these floating or buried plastics break down into smaller pieces, which adds to the microplastic contamination of coastal soils or water (Andrady 2011; Cole et al. 2011). These microplastics enters into the plankton feeding fishes such as Sardines, Anchovies and Mackerel etc. Finally, it reaches into man through food chain (Wright, Thompson, and Galloway 2013; Avio, Gorbi, and Regoli 2017). While this study did not directly test for microplastic ingestion in sand crabs or humans, the presence of buried plastic waste suggests a possible pathway for transfer that needs further investigation. In summary, the buildup of buried plastics on the Thoothoor coast creates ecological risks. It degrades sediment quality, affects benthic organisms, and could potentially introduce plastic particles into the coastal food web, which may have implications for human health (Law 2017; Veerasingam et al. 2020).
The Thoothoor coast is protected by artificial rock structures built along the intertidal zone. These rocks are constantly affected by seawater during both submerged and exposed tidal conditions. They create a suitable surface for edible marine algae like Gracilaria, Porphyra, Ulva and Caulerpa to grow. Local communities harvest and eat these algae, which also serve as an important food source for many herbivorous marine organisms. Plastic wastes, especially plastic bags and covers, often gets caught between the rocks, covering the seaweeds. This layer can block light, interfere with normal algal growth, and disrupt the feeding of herbivorous animals. Over time, exposure to sunlight and wave action breaks the plastic down into microplastics (Andrady 2011; Cole et al. 2011). Herbivorous invertebrates and fish that feed on algae may accidentally swallow these plastic particles along with their food (Wright, Thompson, and Galloway 2013). When herbivorous organisms ingest microplastics, it creates a potential path for plastics to move through the marine food chain. Many of these fish and other marine creatures are eaten by humans, meaning that microplastics and their contaminants may eventually reach people through seafood (Avio, Gorbi, and Regoli 2017; Li, Tse, and Fok 2016). While this study did not directly measure microplastic buildup in algae or marine animals, the presence of plastic litter on artificial rock structures shows a serious ecological issue. It underscores the need for better coastal waste management and more research on food chain transfer.
The artificial rock revetments along the Thoothoor coast provide an important substrate for the settlement of mussel larvae, particularly Perna viridis and Perna indica. These bivalve spats naturally attach to any hard surfaces such as rocks, ropes, mangrove roots, shells, etc. The accumulation of plastic litter on rock revetments may alter the availability and quality of natural settlement surfaces. Mussel larvae may attach to plastic materials that become firmly lodged between the rocks, allowing the mussels to grow while remaining attached to the plastic substrate (Barnes et al. 2009; Gregory 2009). In addition, mussels are filter feeders and can ingest suspended microplastics present in the surrounding seawater (Cole et al. 2011; Wright, Thompson, and Galloway 2013). Since Perna viridis and Perna indica are commonly consumed by humans, the ingestion of microplastics by these bivalves represents a potential pathway for the transfer of plastic particles through seafood to humans (Avio, Gorbi, and Regoli 2017; Law 2017). Although this study did not examine larval settlement on plastics or quantify microplastic accumulation in mussel tissues, the presence of plastic debris on artificial rock revetments suggests that further investigation is needed to evaluate its ecological and public health implications.
The occurrence of plastic debris in the Thoothoor region is particularly concerning because the area supports productive fishing grounds and diverse marine biodiversity. Coastal currents, tidal action, and monsoon-driven circulation may transport plastic materials from nearby coastal areas and concentrate them on beaches. Such transport mechanisms have been identified as important factors controlling the spatial distribution of marine litter in coastal environments (Barnes et al. 2009; Law 2017).
Vallavilai recorded the highest plastic waste accumulation (87.5 kg; 23.97%) among the surveyed villages. The relatively high accumulation may reflect greater local anthropogenic pressure associated with fishing activities, coastal settlements, and plastic disposal practices. In addition, wave action and coastal currents may influence the transport and deposition of plastic debris along the shoreline. However, these potential contributing factors were not independently quantified in the present study and therefore should be interpreted as possible explanations rather than confirmed causes. Further studies incorporating quantitative data on fishing intensity, population density, waste-management practices, and coastal hydrodynamics are required to determine the factors responsible for the higher accumulation at Vallavilai.
A spatial representation of plastic accumulation could further improve interpretation of the observed variation among the surveyed villages. Although the present study identifies relatively higher accumulation at specific locations, a dedicated spatial hotspot analysis was not performed. Future studies incorporating geospatial analysis and environmental variables could provide a more detailed understanding of the spatial patterns of plastic accumulation. The findings of the present study are consistent with global reports indicating that plastic pollution has become one of the major threats to coastal and marine ecosystems (Andrady 2011; Geyer, Jambeck, and Law 2017; Law 2017). Beyond ecological impacts, plastic pollution also affects fisheries, tourism, coastal aesthetics, and the socioeconomic well-being of coastal communities (Jambeck et al. 2015; Sivadas et al. 2021).
5 Conclusion
This study revealed a significant accumulation of plastic waste across the coastal villages of the Thoothoor region, indicating that plastic pollution has become a major environmental concern in the area. The survey identified considerable spatial variations in plastic waste abundance, with some villages exhibiting higher levels of accumulation than others, highlighting localized pollution hotspots. The widespread presence of plastic debris along beaches and nearshore environments poses serious threats to coastal ecosystem health, aesthetic value, and marine biodiversity.
Plastic waste can negatively affect marine organisms through entanglement, ingestion, habitat degradation, and the introduction of microplastics into the food web. The increasing accumulation of plastic debris in the study area reflects inadequate waste management practices, improper disposal of fishing-related materials, and growing anthropogenic pressure on coastal environments.
The findings emphasize the urgent need for effective waste management strategies, regular coastal clean-up programs, community awareness initiatives, and stricter implementation of environmental regulations. Special attention should be given to reducing single-use plastics and promoting sustainable alternatives among coastal communities. Long-term monitoring and further research on microplastic contamination and its ecological impacts are also recommended. Overall, this study provides valuable baseline information on the status of plastic pollution in the Thoothoor coastal region and contributes to the understanding of its potential impacts on coastal ecosystems and marine biodiversity. The results can support policymakers, local authorities, and conservation organizations in developing targeted measures for the protection and sustainable management of coastal resources.
6 Limitations
This study focused primarily on visible macroplastic and mesoplastic debris collected from beaches and rock revetments in the Thoothoor coastal region. Microplastics smaller than 5 mm were not analyzed because laboratory-based sampling and analytical facilities were not available during the present investigation. The assessment was also limited to selected coastal villages and did not include offshore waters, estuaries, or seasonal variations in oceanographic conditions. Furthermore, the study did not directly quantify microplastic ingestion by marine organisms, algae, mussels, or humans. Therefore, the findings should be considered as a baseline assessment of visible plastic pollution, and future studies should incorporate detailed microplastic analysis, chemical characterization, and biological monitoring to better understand the ecological and public health impacts on the plastic contamination in the region.
Environmental variables such as wave energy, coastal currents, beach slope, and sediment grain size were not quantitatively measured in the present study. Therefore, their individual influence on the spatial accumulation of plastic debris could not be directly evaluated. Future studies incorporating these environmental and oceanographic variables would help clarify the processes controlling plastic transport and accumulation along the Thoothoor coast.
7 Recommendations
Based on the findings of this study, the following measures are recommended:
Regular Beach Clean-up Programs; Monthly community-based beach cleaning involving local residents, fishermen, schools, and NGOs; Improved Waste Management Infrastructure; Installation of segregated waste collection bins in all coastal villages; Establishment of plastic collection and recycling centres; Fishermen Awareness Programmes; Training on responsible disposal of damaged fishing nets, ropes, and gear; Promotion of “Fishing for Litter” initiatives where fishermen bring collected marine debris back to shore; Restriction of Single-Use Plastics; Strict implementation of existing plastic ban regulations in coastal areas; Promotion of reusable alternatives; School and Community Education; Awareness campaigns highlighting the impacts of plastic pollution on marine biodiversity and human health; Long-Term Monitoring; Seasonal monitoring of plastic accumulation using standardized survey methods; Inclusion of microplastic assessments in future studies; GIS-Based Monitoring; Development of pollution hotspot maps to identify priority areas for management and cleanup; Marine Biodiversity Monitoring; Regular assessment of fish, shellfish, and other marine organisms for plastic ingestion and entanglement impacts.
Artificial intelligence (AI) tools were used solely for grammatical correction and language improvement. The authors reviewed and verified all content and take full responsibility for the accuracy and integrity of the manuscript.
References
Publication Information
- Submitted: 19 June 2026
- Accepted: 11 August 2026
- Published (Online): 12 August 2026
Reviewer Information
Reviewer 1:
Dr.Harsha Haridas
Scientist
ICAR-CIFEReviewer 2:
Dr.Anjali N
Kerala University of Fisheries and Ocean Studies
The statements, opinions and data contained in all publications are solely those of the individual author(s) and contributor(s) and not of the publisher and/or the editor(s).
The publisher and/or the editor(s) disclaim responsibility for any injury to people or property resulting from any ideas, methods, instructions or products referred to in the content.
© Copyright (2025): Author(s). The licensee is the journal publisher. This is an Open Access article distributed under the terms of the Creative Commons Attribution-NonCommercial-NoDerivatives 4.0 International License, which permits non-commercial use, sharing, and reproduction in any medium, provided the original work is properly cited and no modifications or adaptations are made.